Guest post by Juraj Čáp, PhD. Associate Professor (Systematic Philosophy), Jessenius Faculty of Medicine in Martin, Comenius University in Bratislava, Slovakia
Sometimes it can be confusing to know how to use a CAQDAS program for a specific qualitative data analysis method because the software is usually not directly adapted to it, and so you need to be creative and improvise. Our research team has been investigating phenomena such as dignity and trust in the context of healthcare for more than 10 years, using Interpretive Phenomenological Analysis (IPA) and ATLAS.ti. IPA is characterized by its specific analysis procedure and the terminology used to describe it. In this blog, I summarize our experiences and how we faced the challenge of using ATLAS.ti and IPA and offer some practical guidance for others seeking to do similar analysis.
Guest posts express the views of guest contributors and do not necessarily represent the views of the CAQDAS Networking Project or constitute an endorsement of any product, method or opinion.
Specifics of IPA
IPA is a relatively widespread method of analysis in the field of psychology, especially health psychology, and is increasingly being used in other scientific disciplines, such as nursing. The basic goal of an IPA study is to gain a deeper understanding of how people make sense of their lived experience. The authors of the method are Jonathan A. Smith, Paul Flowers, and Michael Larkin, who built it on three basic pillars: phenomenology, hermeneutics, and an idiographic approach. The approach is phenomenological in that it includes a detailed examination of the participant’s lifeworld (from a first-person perspective). It is also hermeneutical because a two-stage interpretation process (double hermeneutic) is involved, meaning that participants are trying to make sense of their lived experience and the researcher is trying to make sense of how the participants are trying to make sense of their experience. IPA is also a strongly idiographic approach concerned with detailed analysis of the case by case. Each individual’s experience is analysed within the context of the individual’s narrative before the patterns of similarity and difference between cases are identified during cross-case analysis. This last point is essential for working with software like ATLAS.ti, because IPA requires that each interview is analysed separately, and therefore each interview is analysed in a separate Project in ATLAS.ti. This contrasts with methods like reflexive thematic analysis, where you can analyse all interviews together in one software Project. From this point of view, IPA is essentially a type of case study research.
Analytical Process of IPA
The analytical process in IPA is divided into several steps. In the first step, the researcher reads the interview transcript several times to obtain more comprehensive insight and begins with initial reflection. In our case, we did an initial reflection on the printed transcript of the interview, where we took notes. Part of this step was also listening to the interview again in order to better grasp of the context, including emotions. In the second step, Exploratory Notes (ENs) are made.
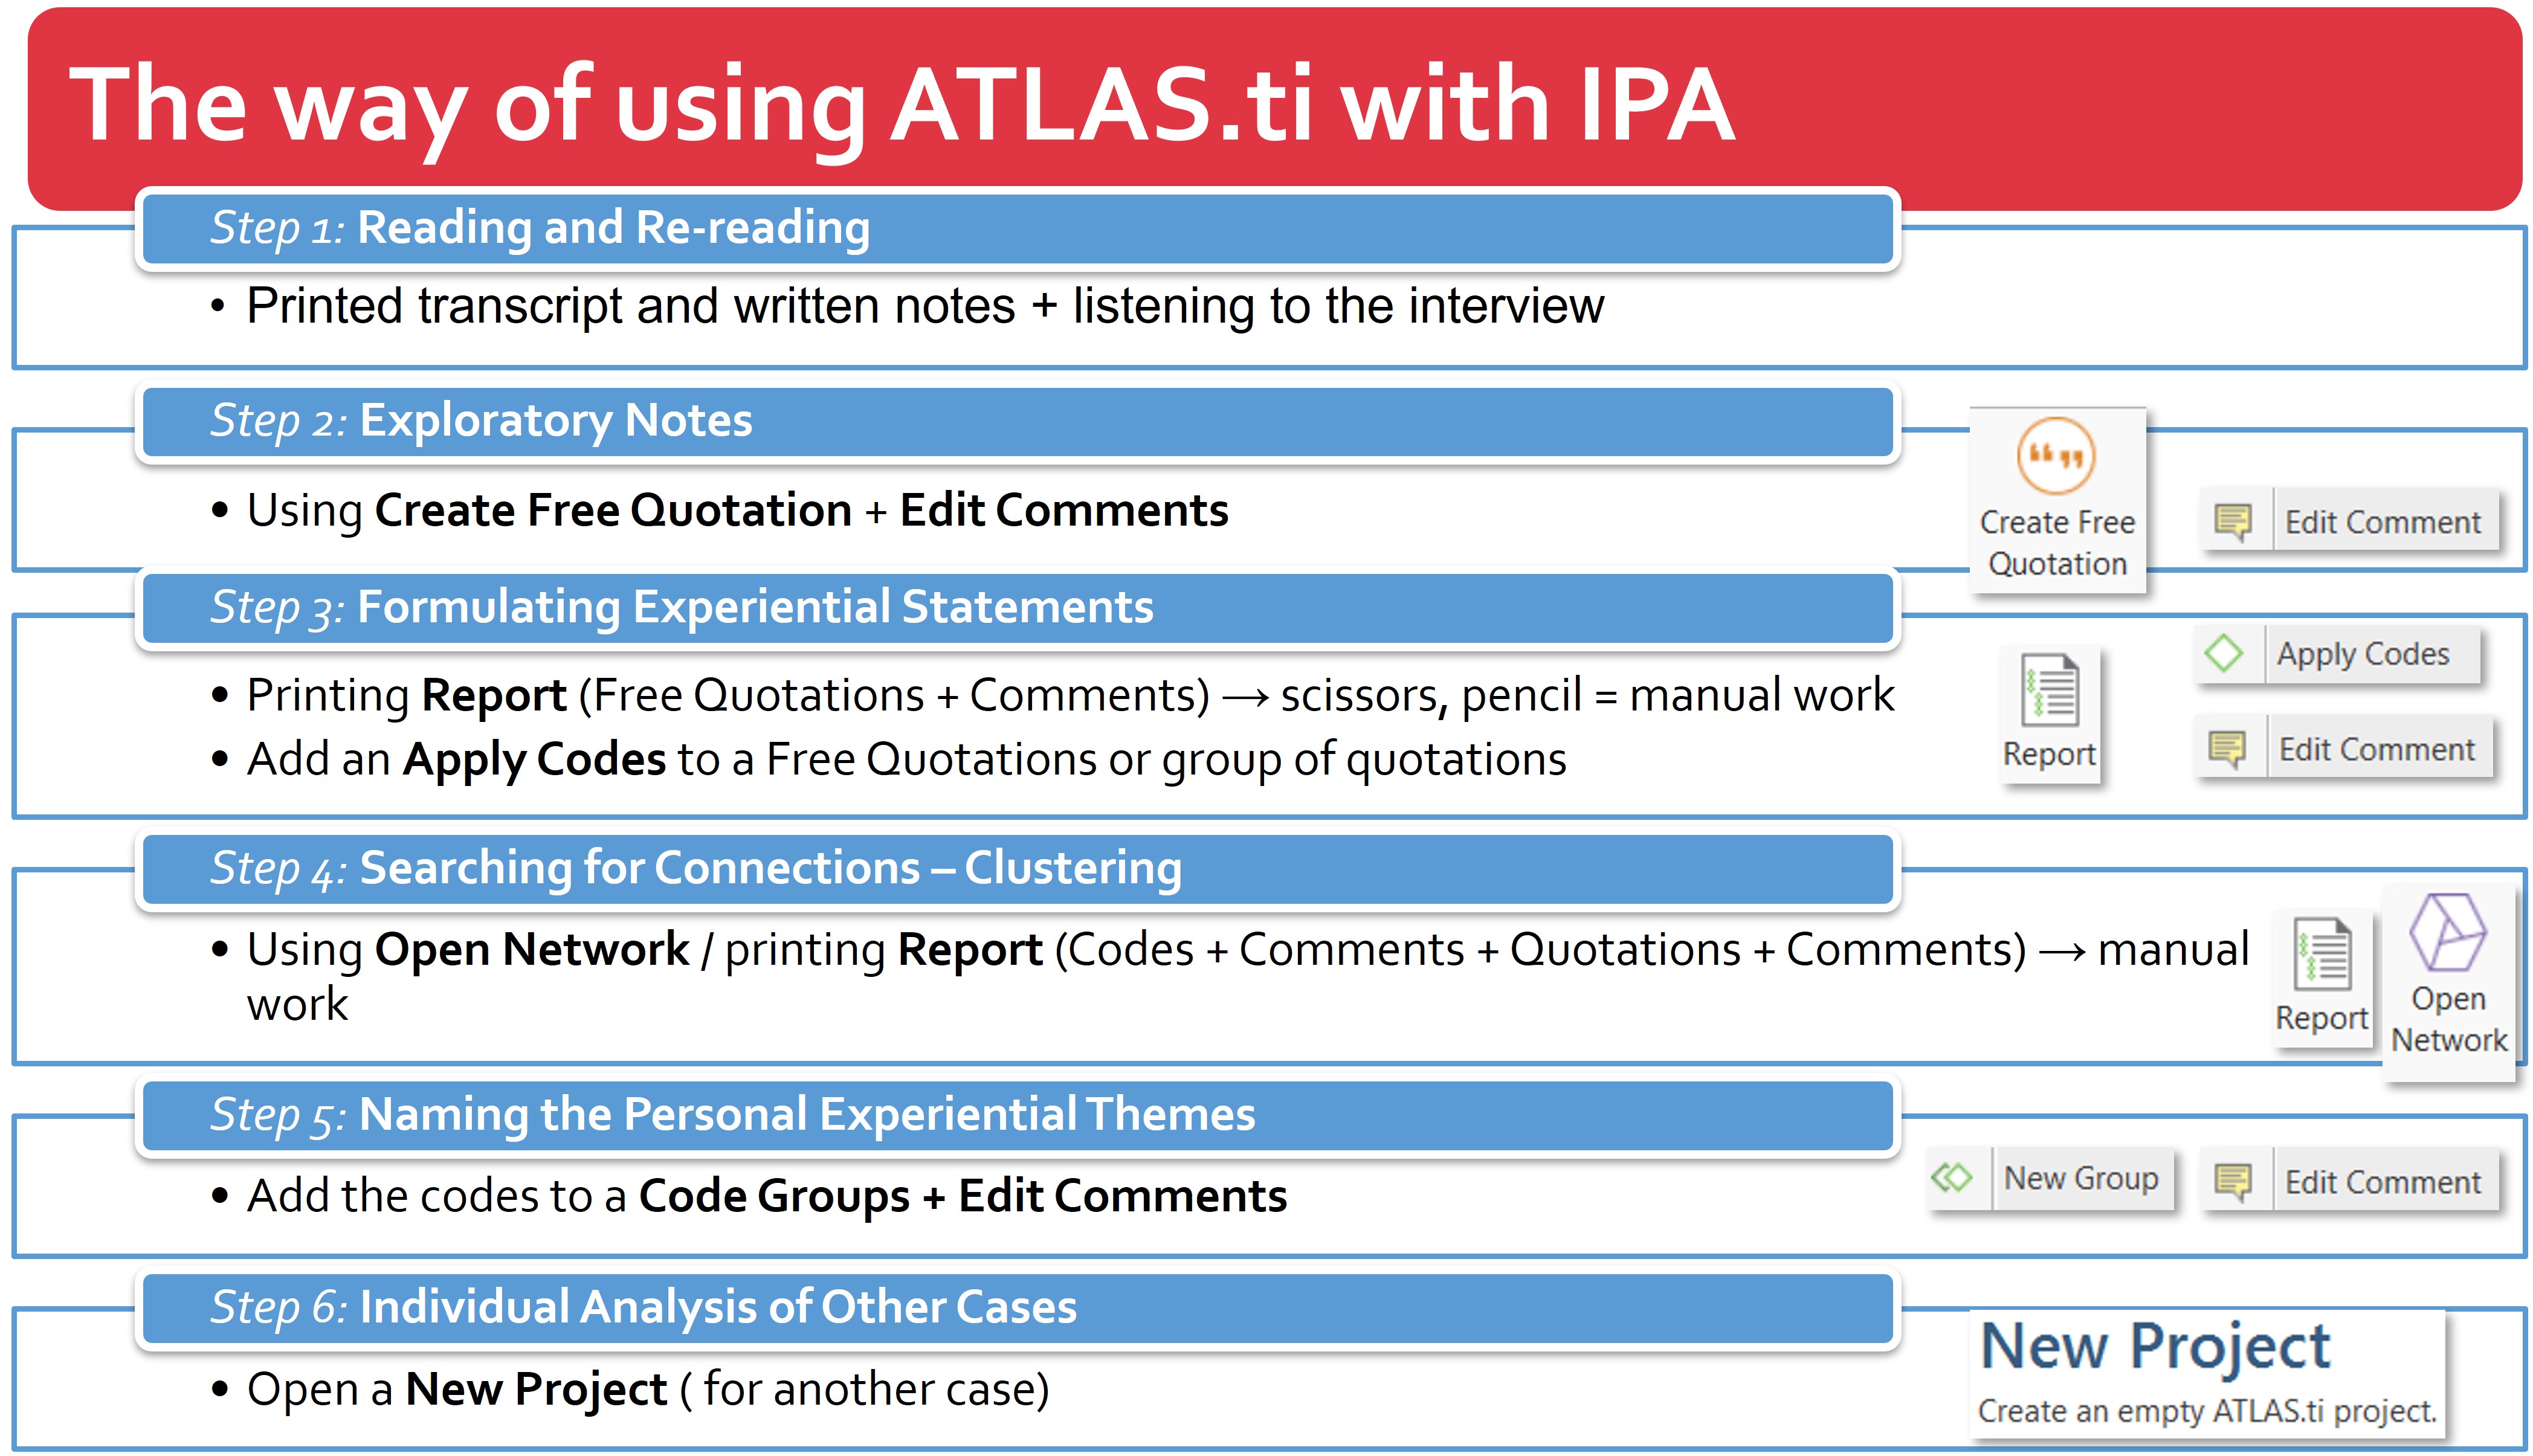
There are several types of ENs, including descriptive, linguistic, and conceptual.
- The descriptive ENs are designed to summarize the experience of the participant (in the terms if is recounted to the researcher) captured in the quotation.
- Linguistic ENs focus on specific linguistic expressions made by the participant, such as metaphors and repetitive expressions, which are often related to the meaning of the participant’s experience.
- Conceptual ENs go beyond the description of the experience and aim at the interpretation (hermeneutics) of a given partial experience with a focus on meaning to the participant.
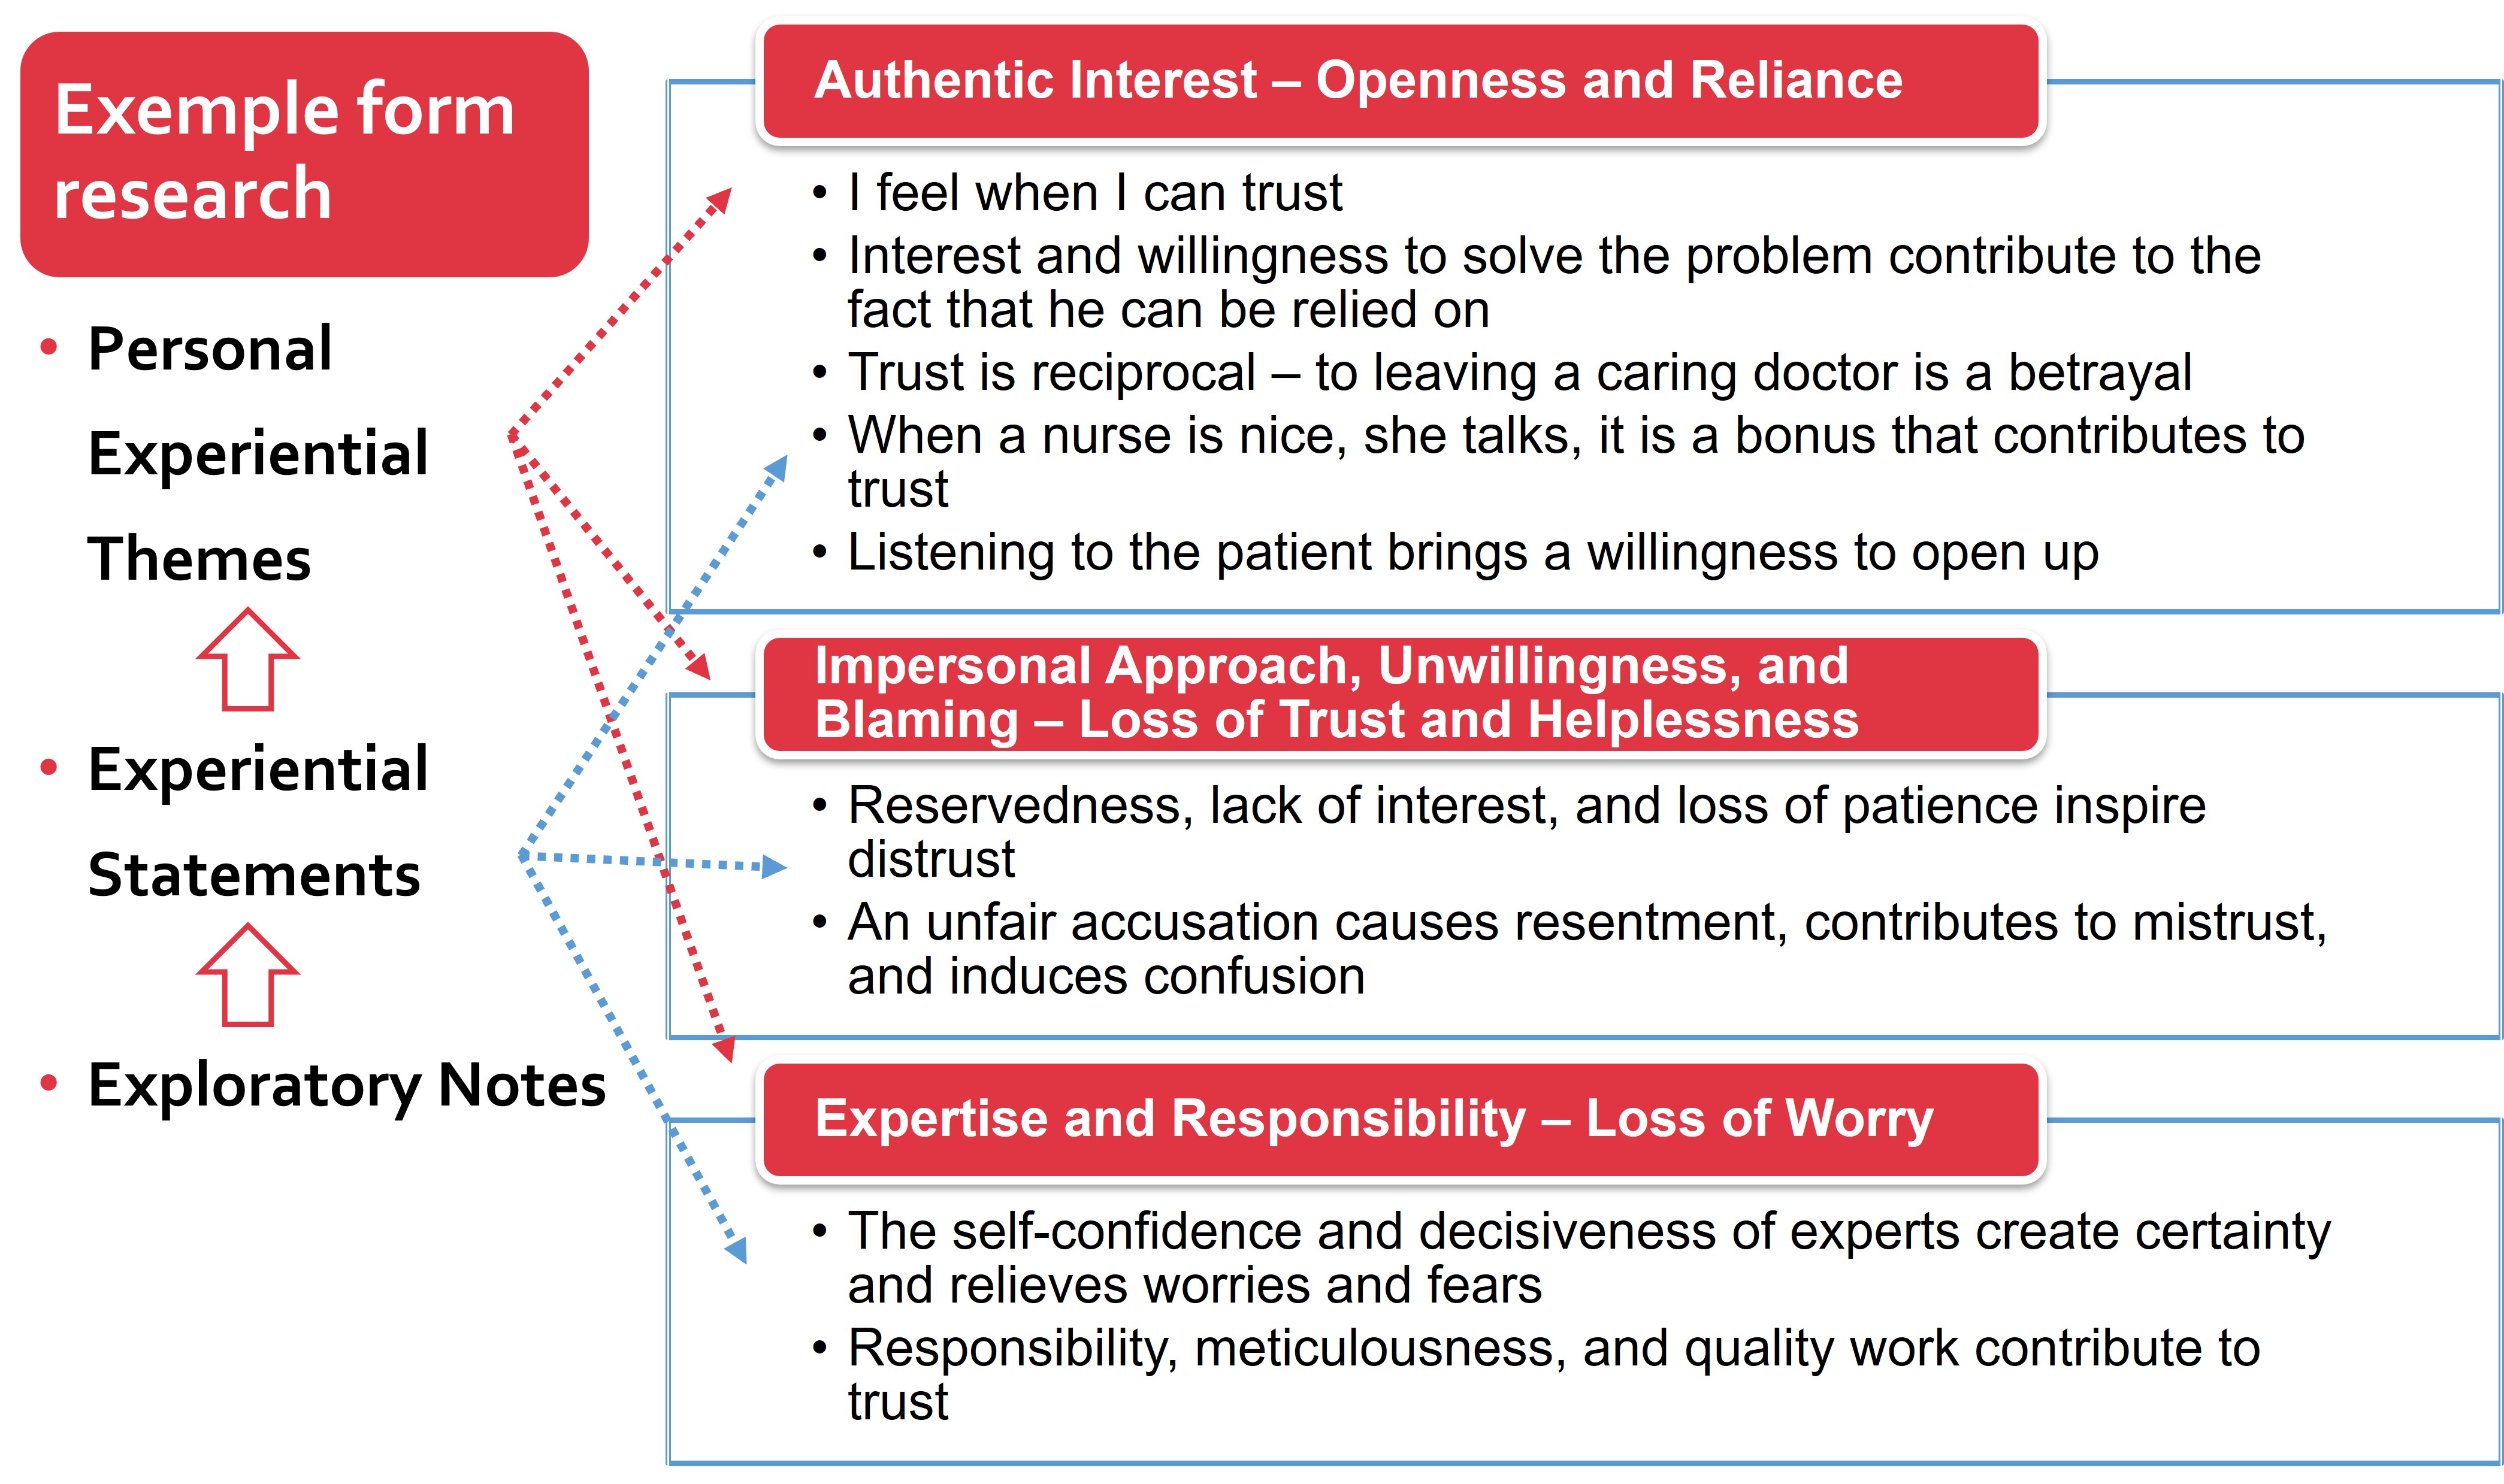
Based on ENs, Experiential Statements (ESs) are formulated to capture the important aspect of the participant’s experience. ESs are created in the form of a sentence that captures the basic idea, let us say the main message of a particular part of the data. In the next step, ESs are grouped into Personal Experiential Themes (PETs) based on connections and patterns between statements. In the last step, cross-case analysis is performed to identify connections, similarities, and differences to develop Group Experiential Themes (GETs).
How we used ATLAS.ti
As I mentioned, we created one ATLAS.ti Project for each interview. First, we uploaded the transcript of the interview to ATLAS.ti (Add Documents), which we had read several times before. We created a Memo that included the participant’s demographic data and our field notes. Then we read the transcript and started creating ENs. At this stage, the Create Free Quotation function, along with the Edit Comments function, helped us greatly because we could record our descriptive, linguistic, and conceptual comments without any initial coding.
After this phase, we created a Report consisting of Free Quotations plus Comments and cut everything up so that we could do research directly on the desk, which was most functional for us. This ‘old-school way’ helped us analyse and connect the quotations with the ESs that we had noted on paper.
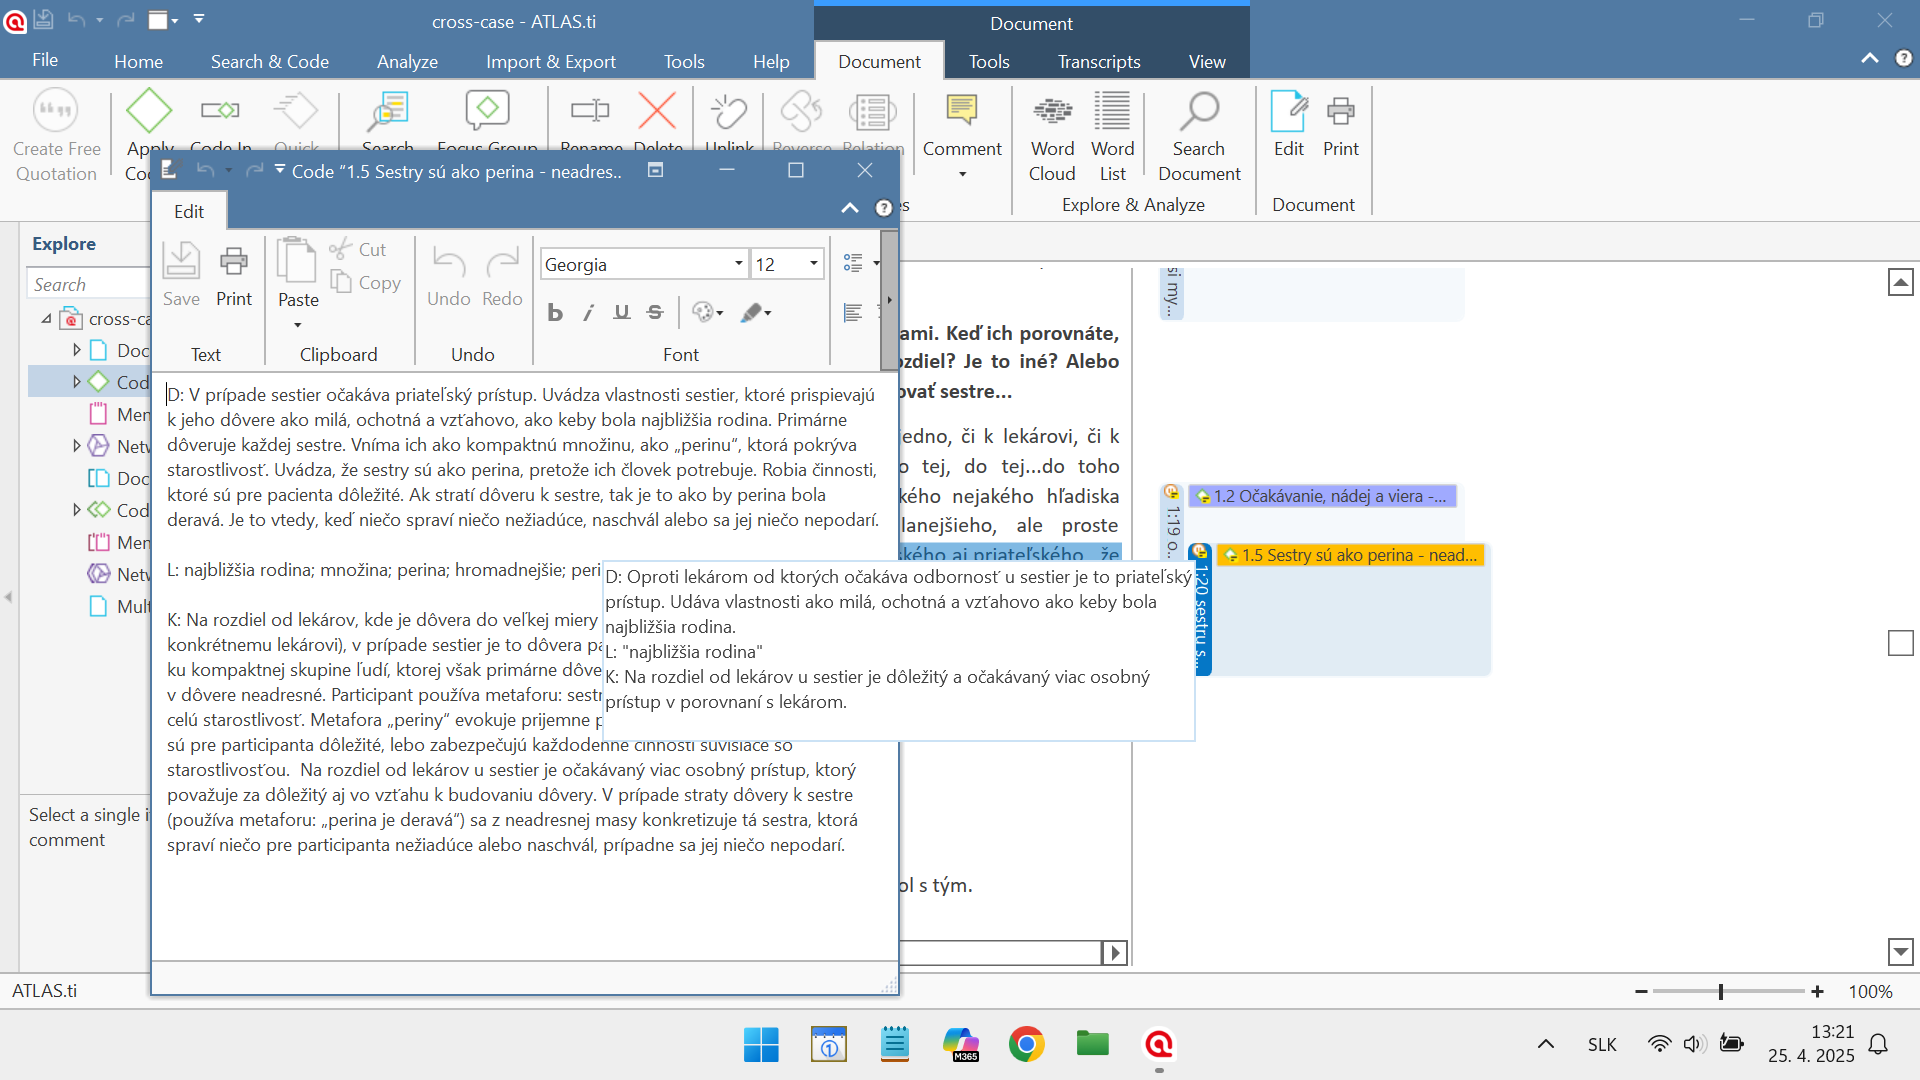
Above image showing an example of quotations and comments in ATLAS.ti
Then we re-opened ATLAS.ti and used the Apply Codes function for the particular quotations. We write ES in the code name and make a description based on the ENs in the Code Comment. At the end of this process, we printed a Report with Codes and their Comments, the corresponding Quotations and their Comments, so that we could go through the data from the quotation, ENs to ESs, and vice versa. Here we combined manual work with the printed Report and work with ATLAS.ti. In this part of the analytical process, ATLAS.ti’s Network function served us well. In a Network it was possible to visually move and group individual ESs and thus form them into groups of future PETs. We came up with the names of the PETs reflecting the meaning of selected ESs, and in ATLAS.ti we used the Code Groups function to include the relevant ESs and gave them the names of PETs. In the Code Group Comment, we write the PET characteristics based on the associated quotations, ENs, and ESs. This is how the analysis of one interview was created, and we used the same procedure for each subsequent interview.
After analysing each individual interview transcript, we moved on to the cross-case analysis phase. We used the Merge Project function and created one project containing all the previous analyses that had been in individual ATLAS.ti projects. Manual work was again required. We printed a Report that contained PETs, ESs, and their comments for all interviews. We used scissors and a table again and began to group PETs and ESs on the basis of their similarities and differences. From this process, groups were created on the table that were the basis for the subthemes of individual GETs.
When we discussed the challenging areas and identified the names of the subthemes and GETs within the research team, we returned to ATLAS.ti. We deleted the original PETs and, based on the analysis we did on the table, assigned the ESs to each other and created new Code Groups that represented a subtheme in IPA. When we had done this with the entire material, we used the New Smart Group function, a tool in ATLAS.ti to group codes, to gather the relevant subthemes together, and named each Smart Group as a GET. The use of colours was also helpful throughout the process, for example, to differentiate subthemes in the final phase of the analysis.
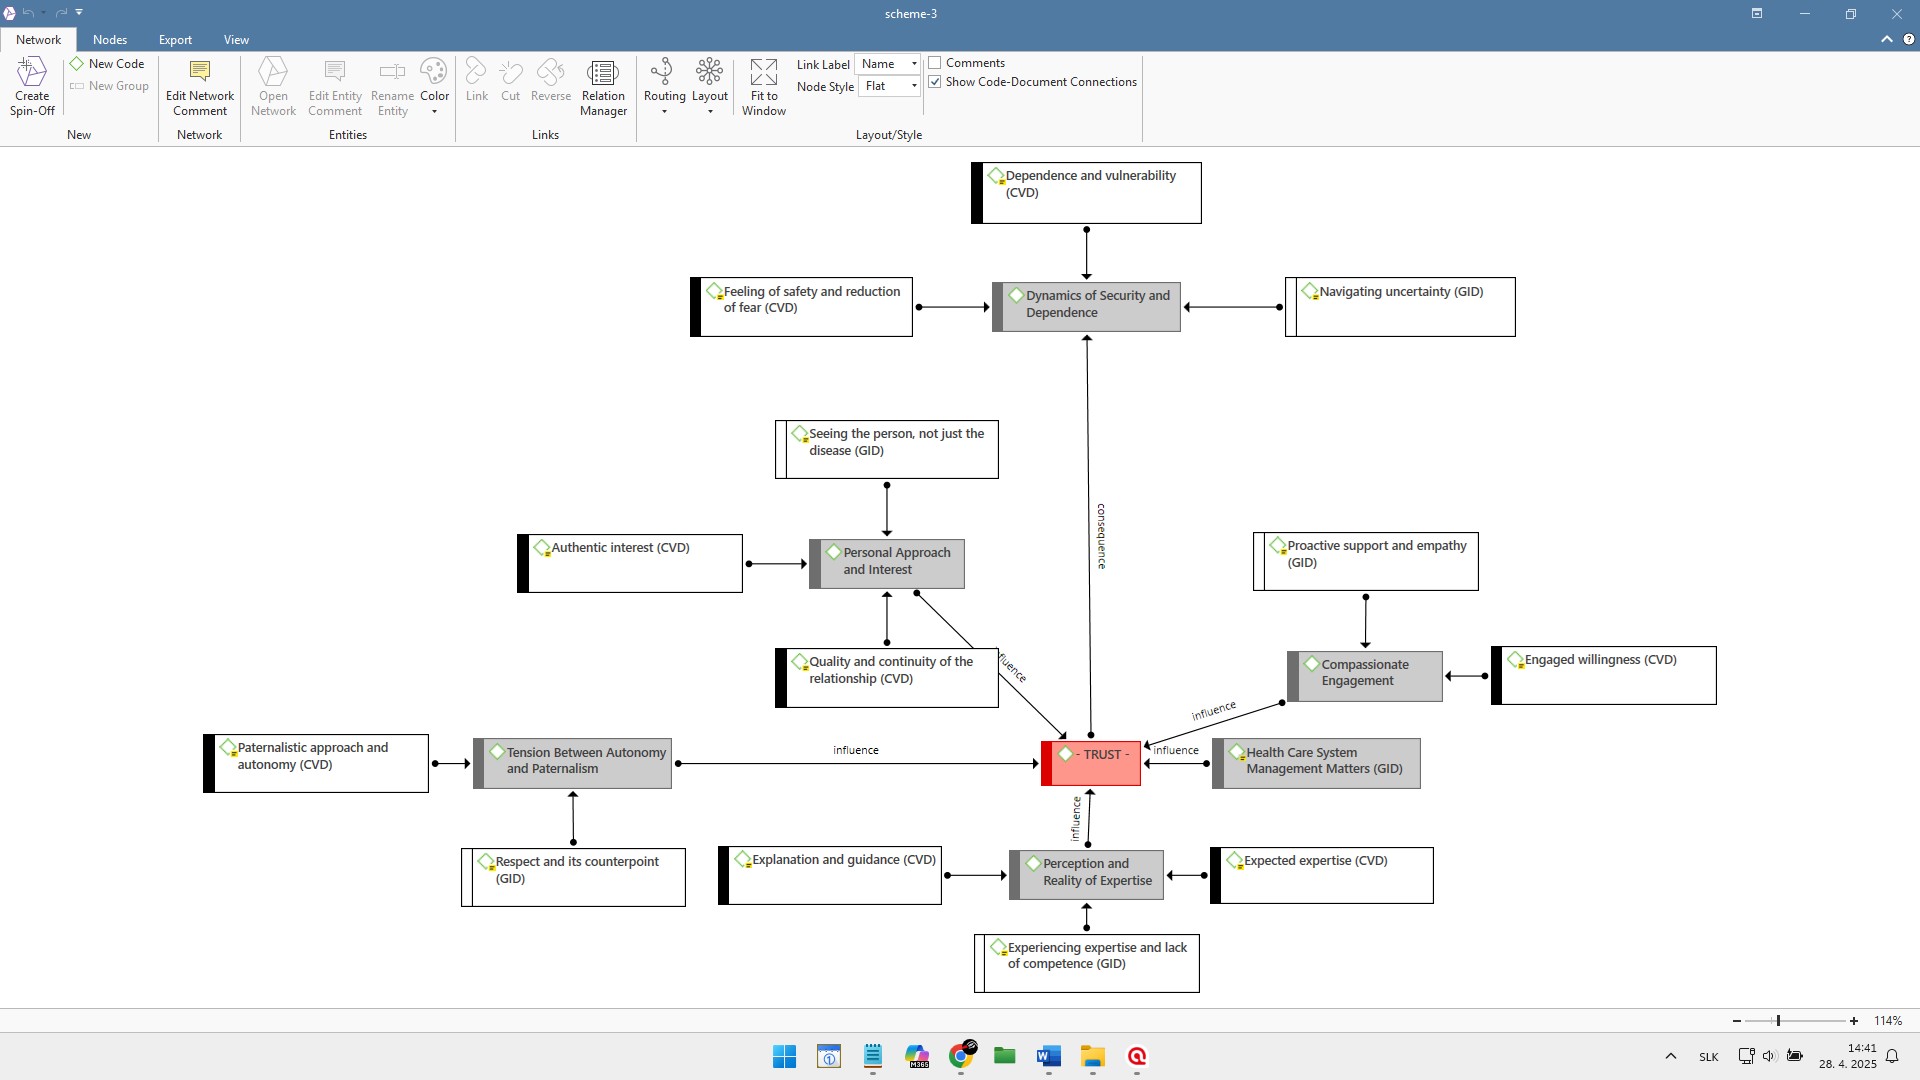
Above image showing an example Network being used for IPA in ATLAS.ti
After this, the IPA analysis process was completed. At the end, the Network function was useful for creating a graphic scheme to show specific relations (Create Relation Type) between GETs and subthemes. But for this, we have used a new clean Project where we enter all GETs and subthemes as New Codes and distinguish them by colour. The reason is simple, relations cannot be made between Code Groups and Smart Groups in ATLAS.ti (Ver. 9.), which is quite limiting for the purposes of this aspect of IPA.
I hope this description gives a clear idea of our approach. I trust that when you open ATLAS.ti and start your new IPA research, our way of combining IPA and ATLAS.ti will inspire you and make your work a bit easier.
AI use: This post was conceived totally by the author and written in Microsoft Word without any contribution from AI tools. Writefull Revise was used for initial proofreading of the text in English.
Acknowledgements: I am thankful to my colleague Lucie Podolinská for her critical comments and Christina Silver for her assistance with final proofreading the English and suggestions.