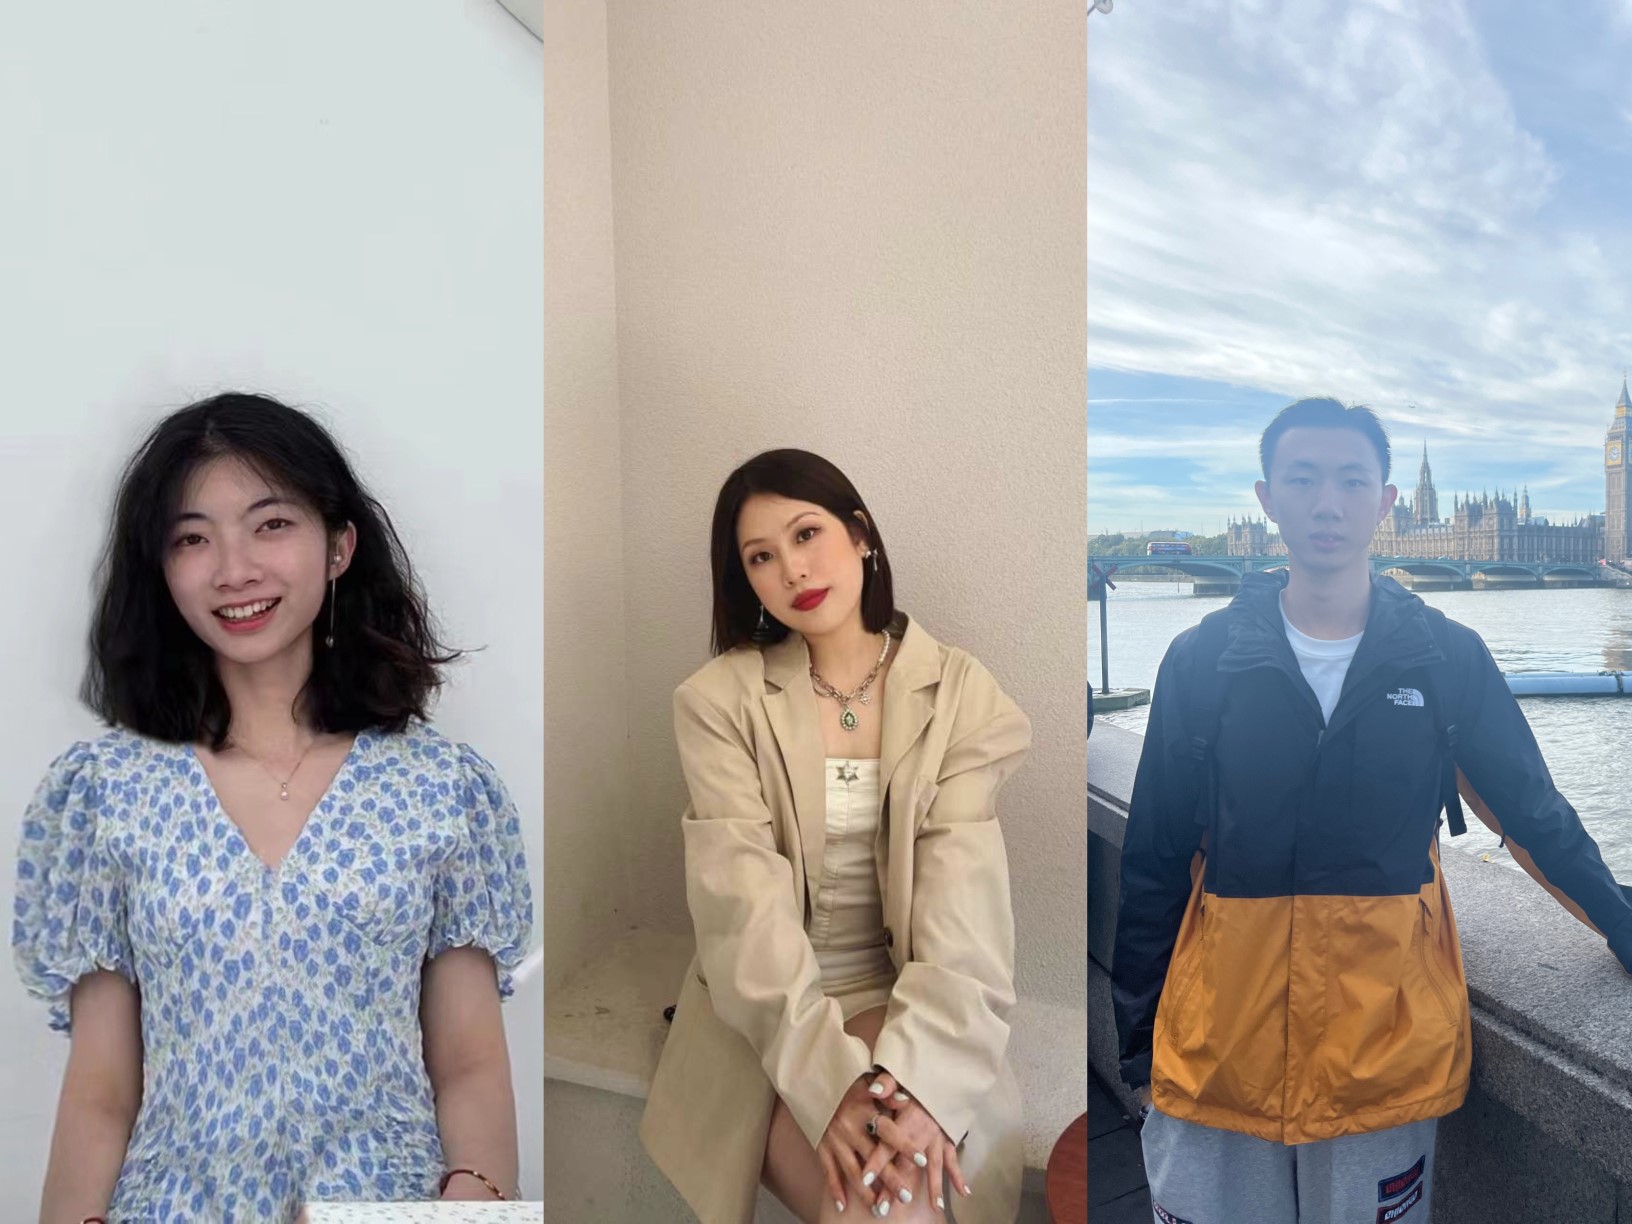
China Student Ambassadors – Haiying, Jiali and Qiancheng
From Hong Kong to the UK.

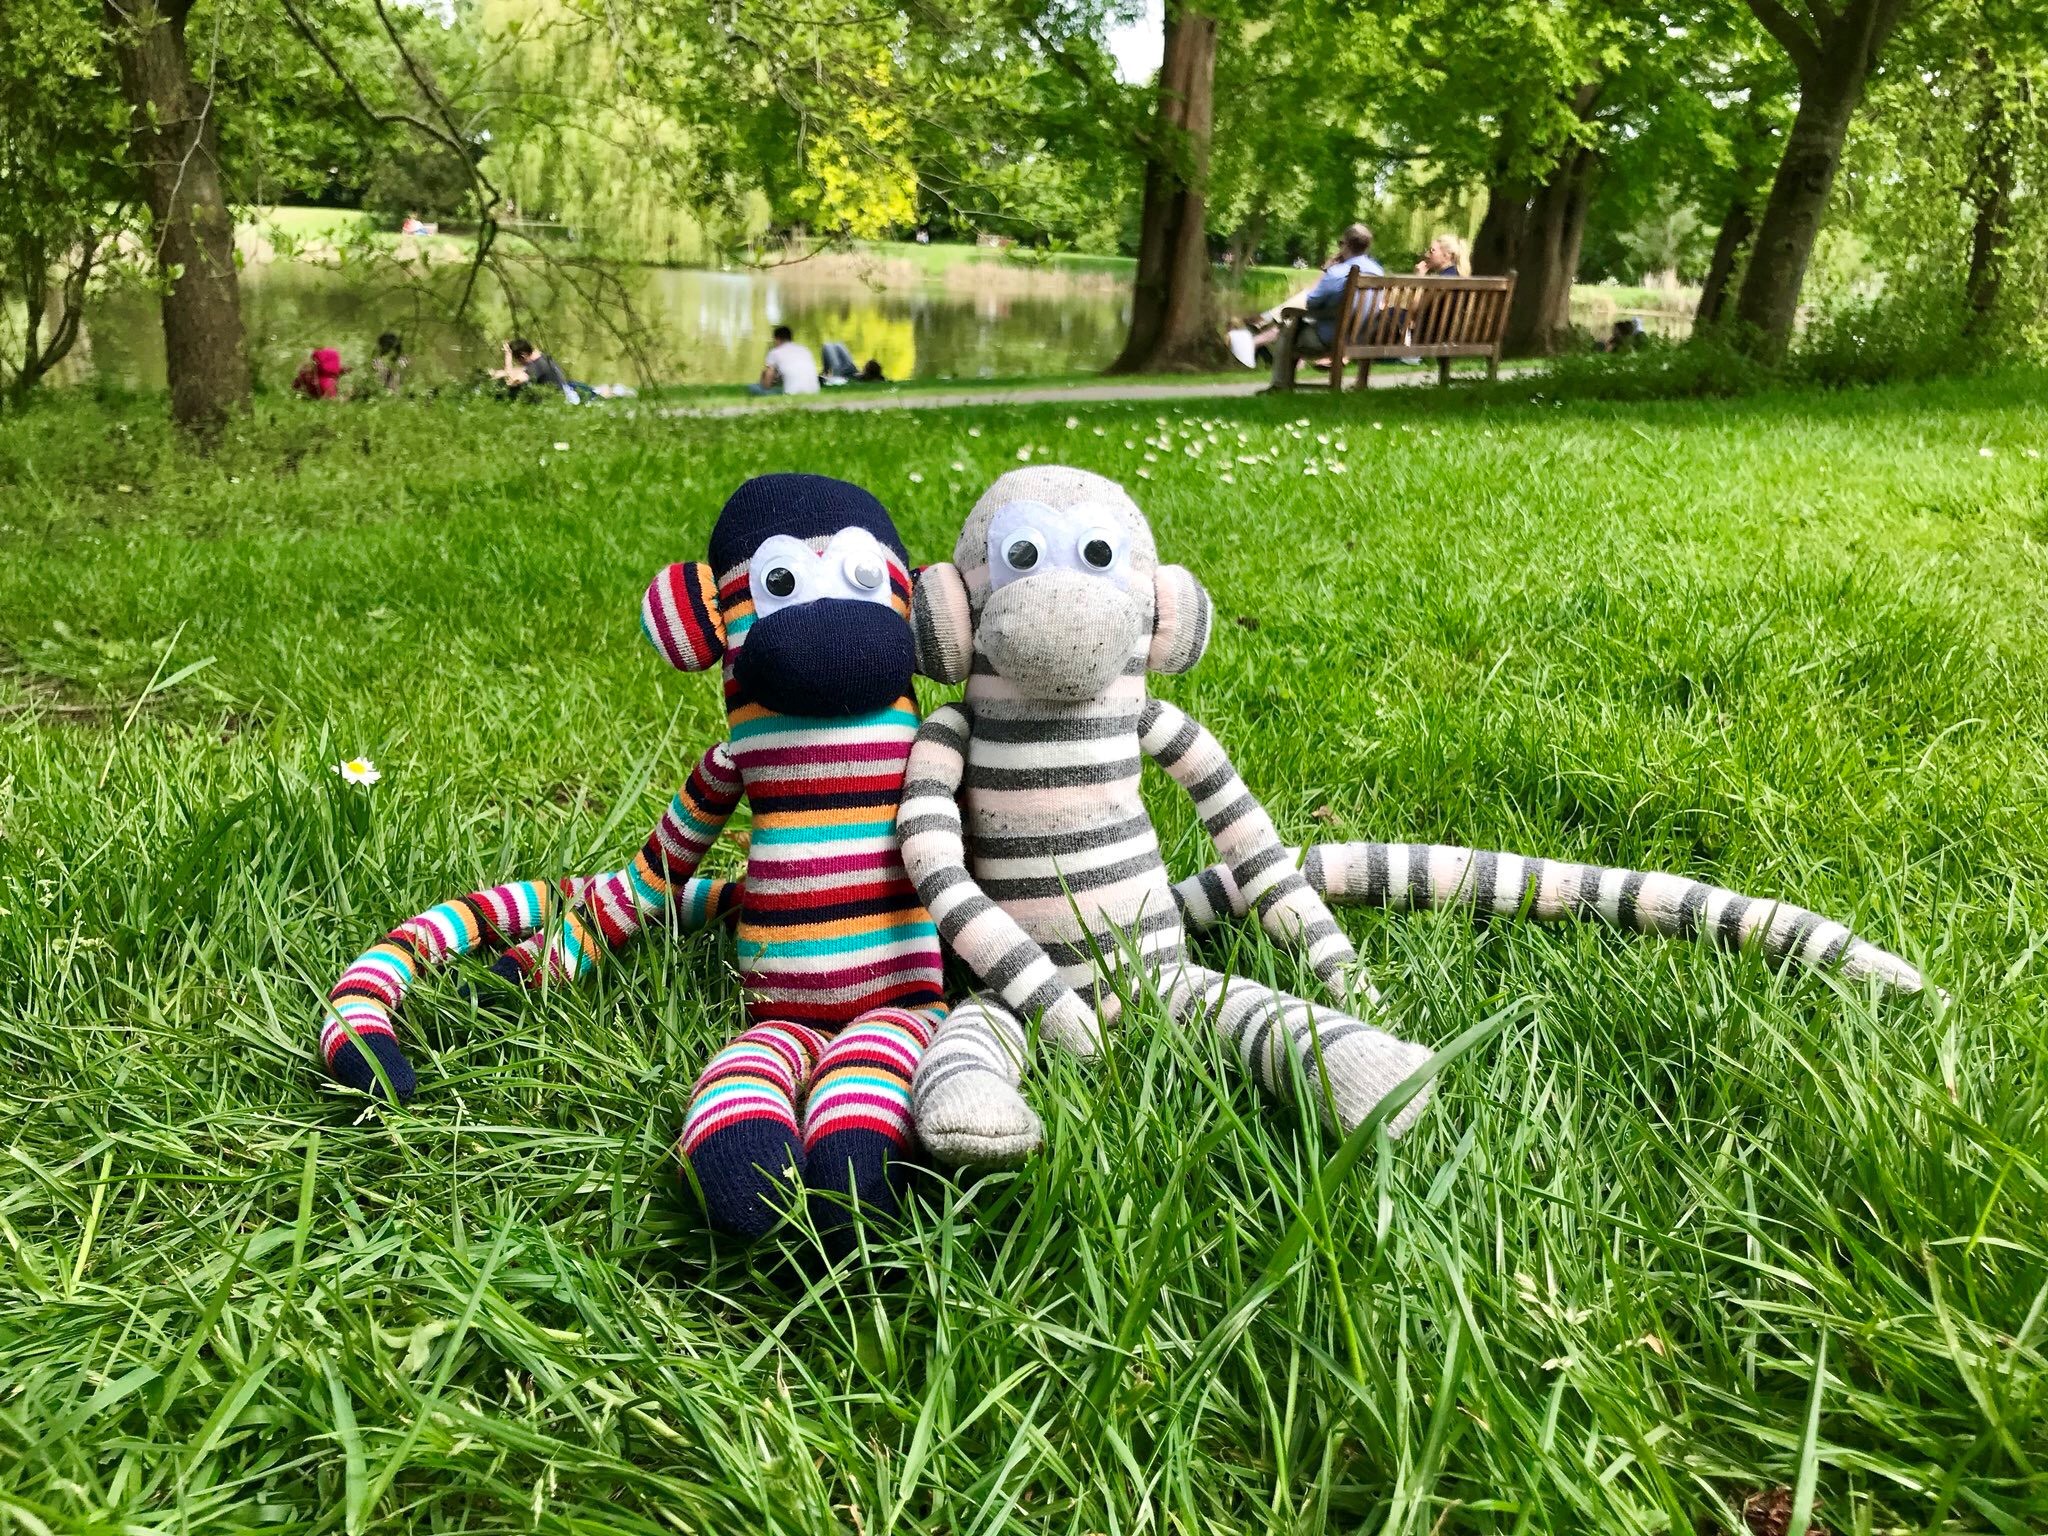
Follow the adventures of Surrey students abroad!

The blog on research in mathematics at the University of Surrey
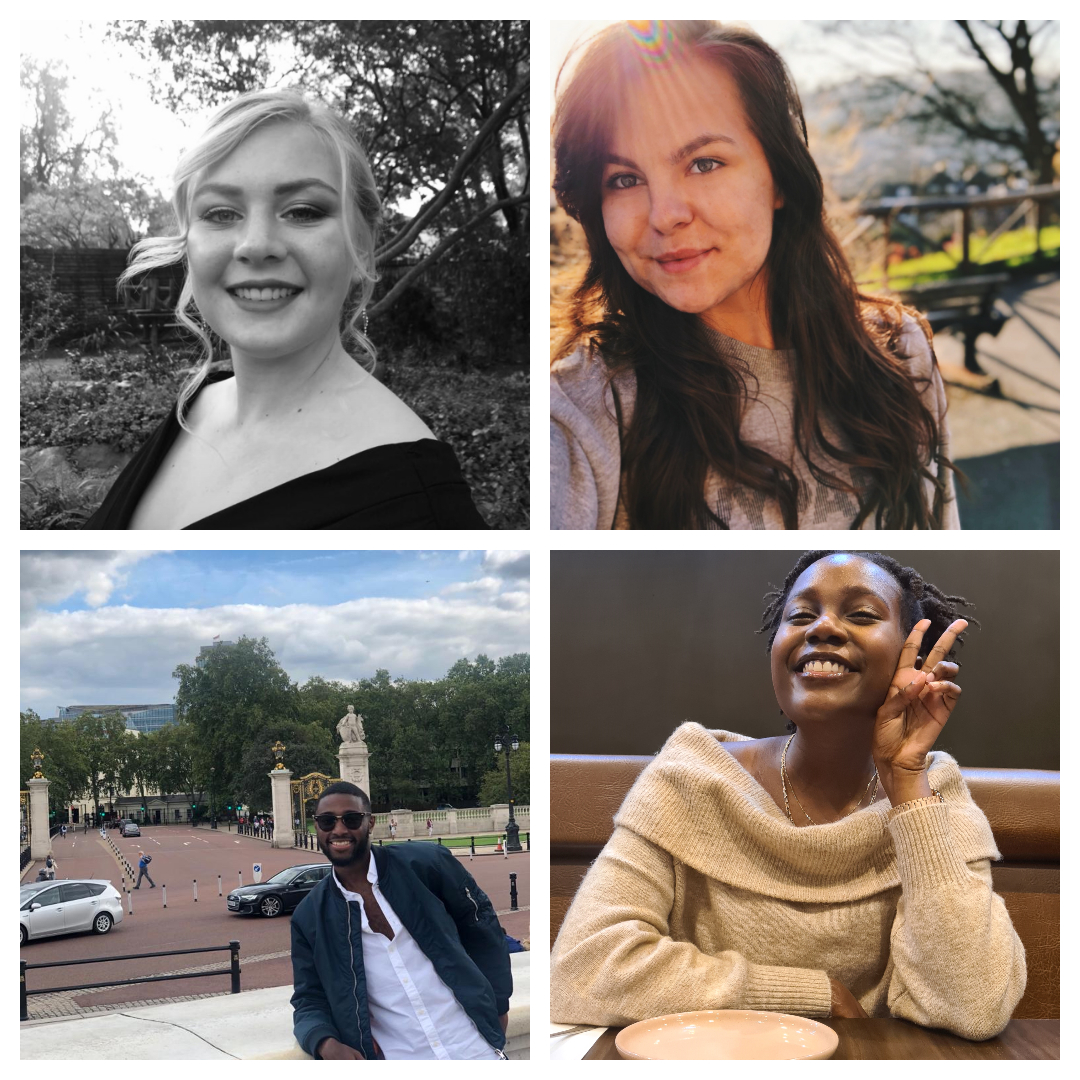
An insight into life at Surrey from current African students

The blog of the Department of Sociology at the University of Surrey
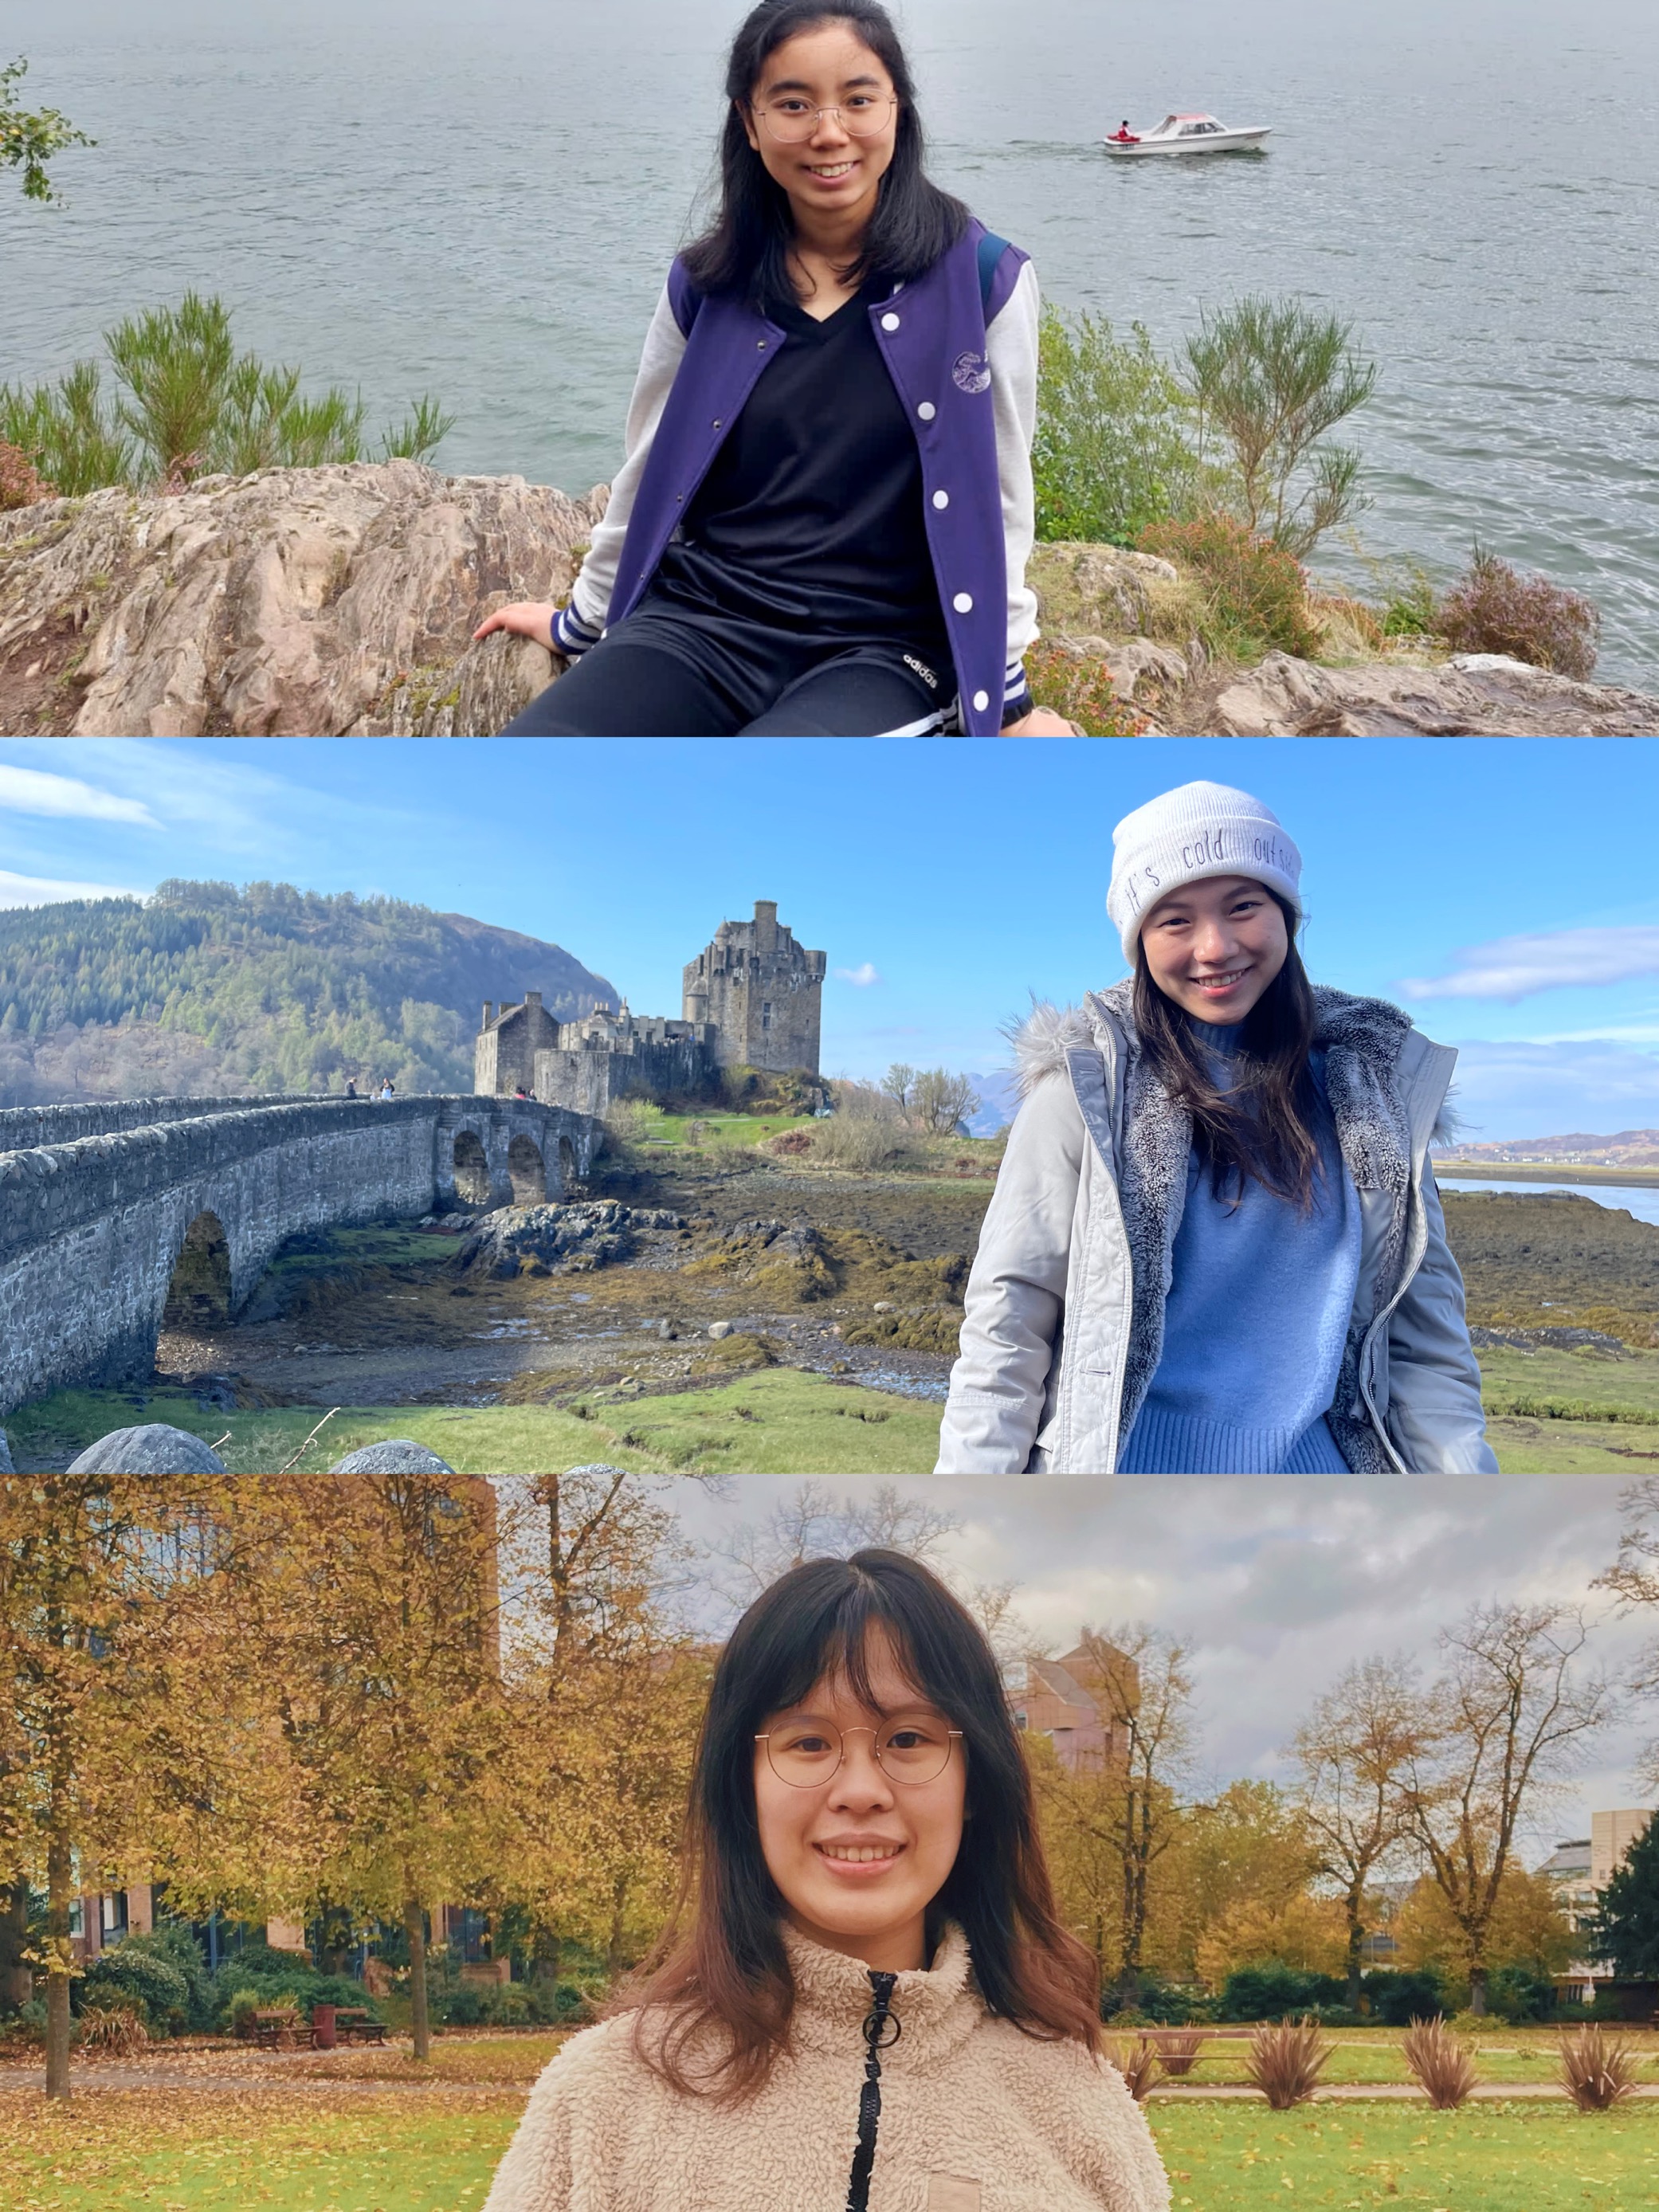
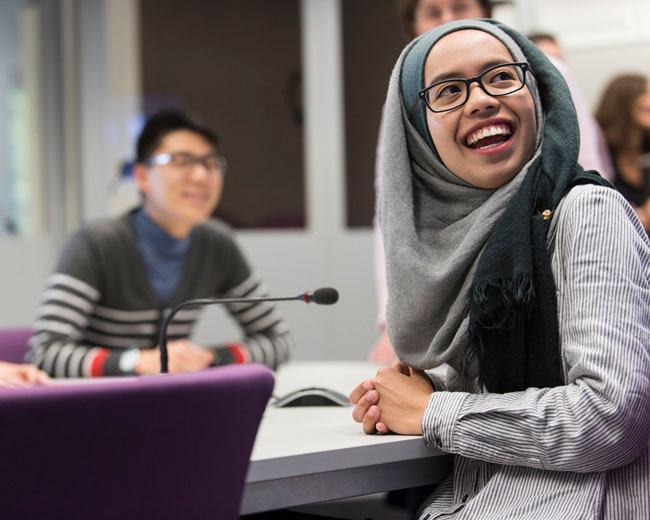
Keeping up with the lives of Malaysian students currently studying at Surrey

An International Network Funded by the Leverhulme Trust
Support, encouragement and skills development for enterprising students

An insight into life at Surrey from a current Caribbean student
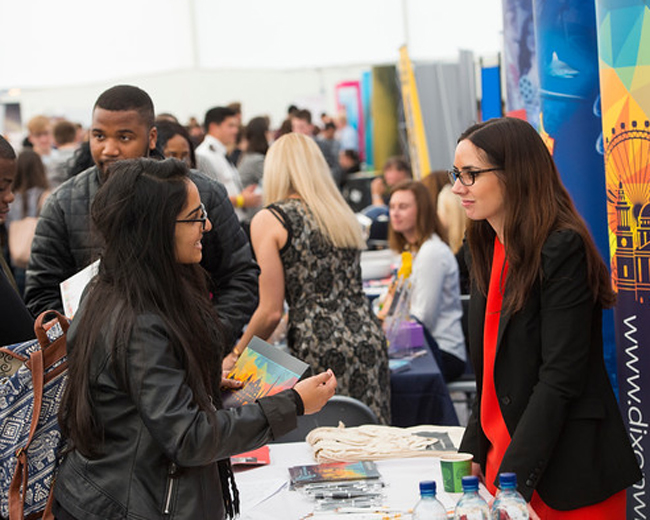
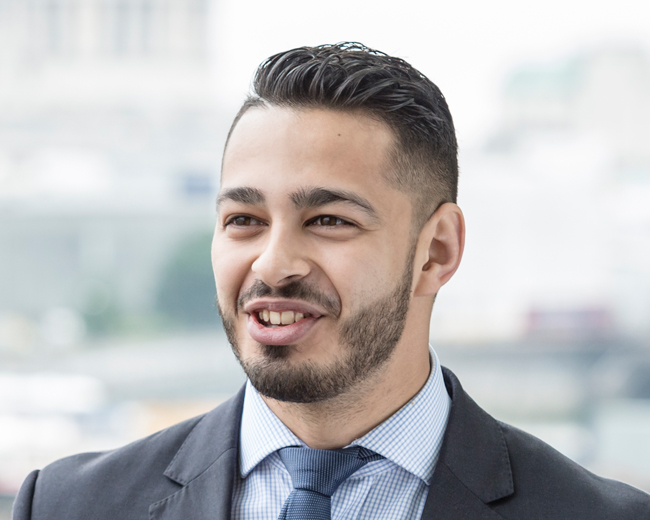
Official blog of the University of Surrey's Employability and Careers Centre

Current students share their thoughts on planning for university, student life and what it’s like to study at the University of Surrey.
Stories from a Russian student at Surrey
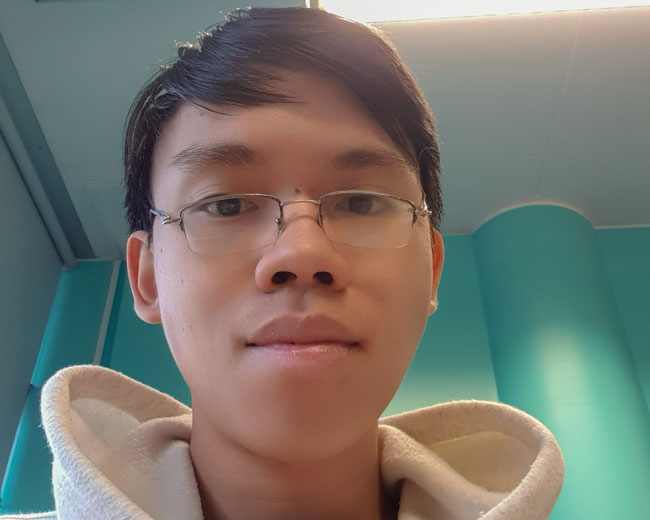
An insight into life at Surrey from a current Vietnamese student.
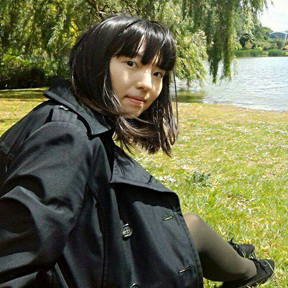
The experiences of a Japanese student at Surrey
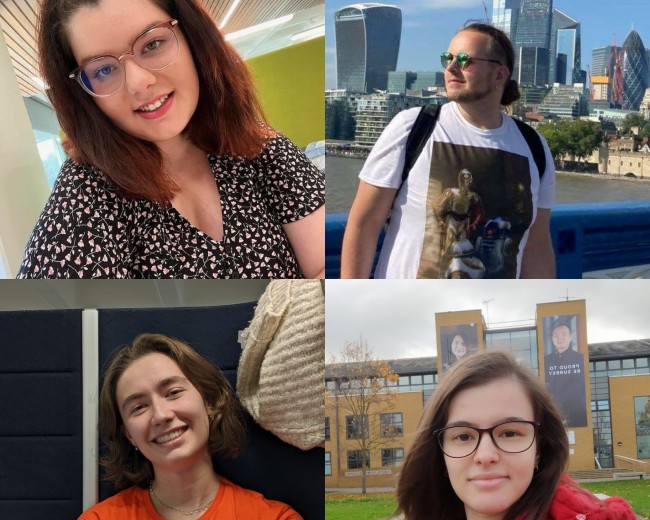
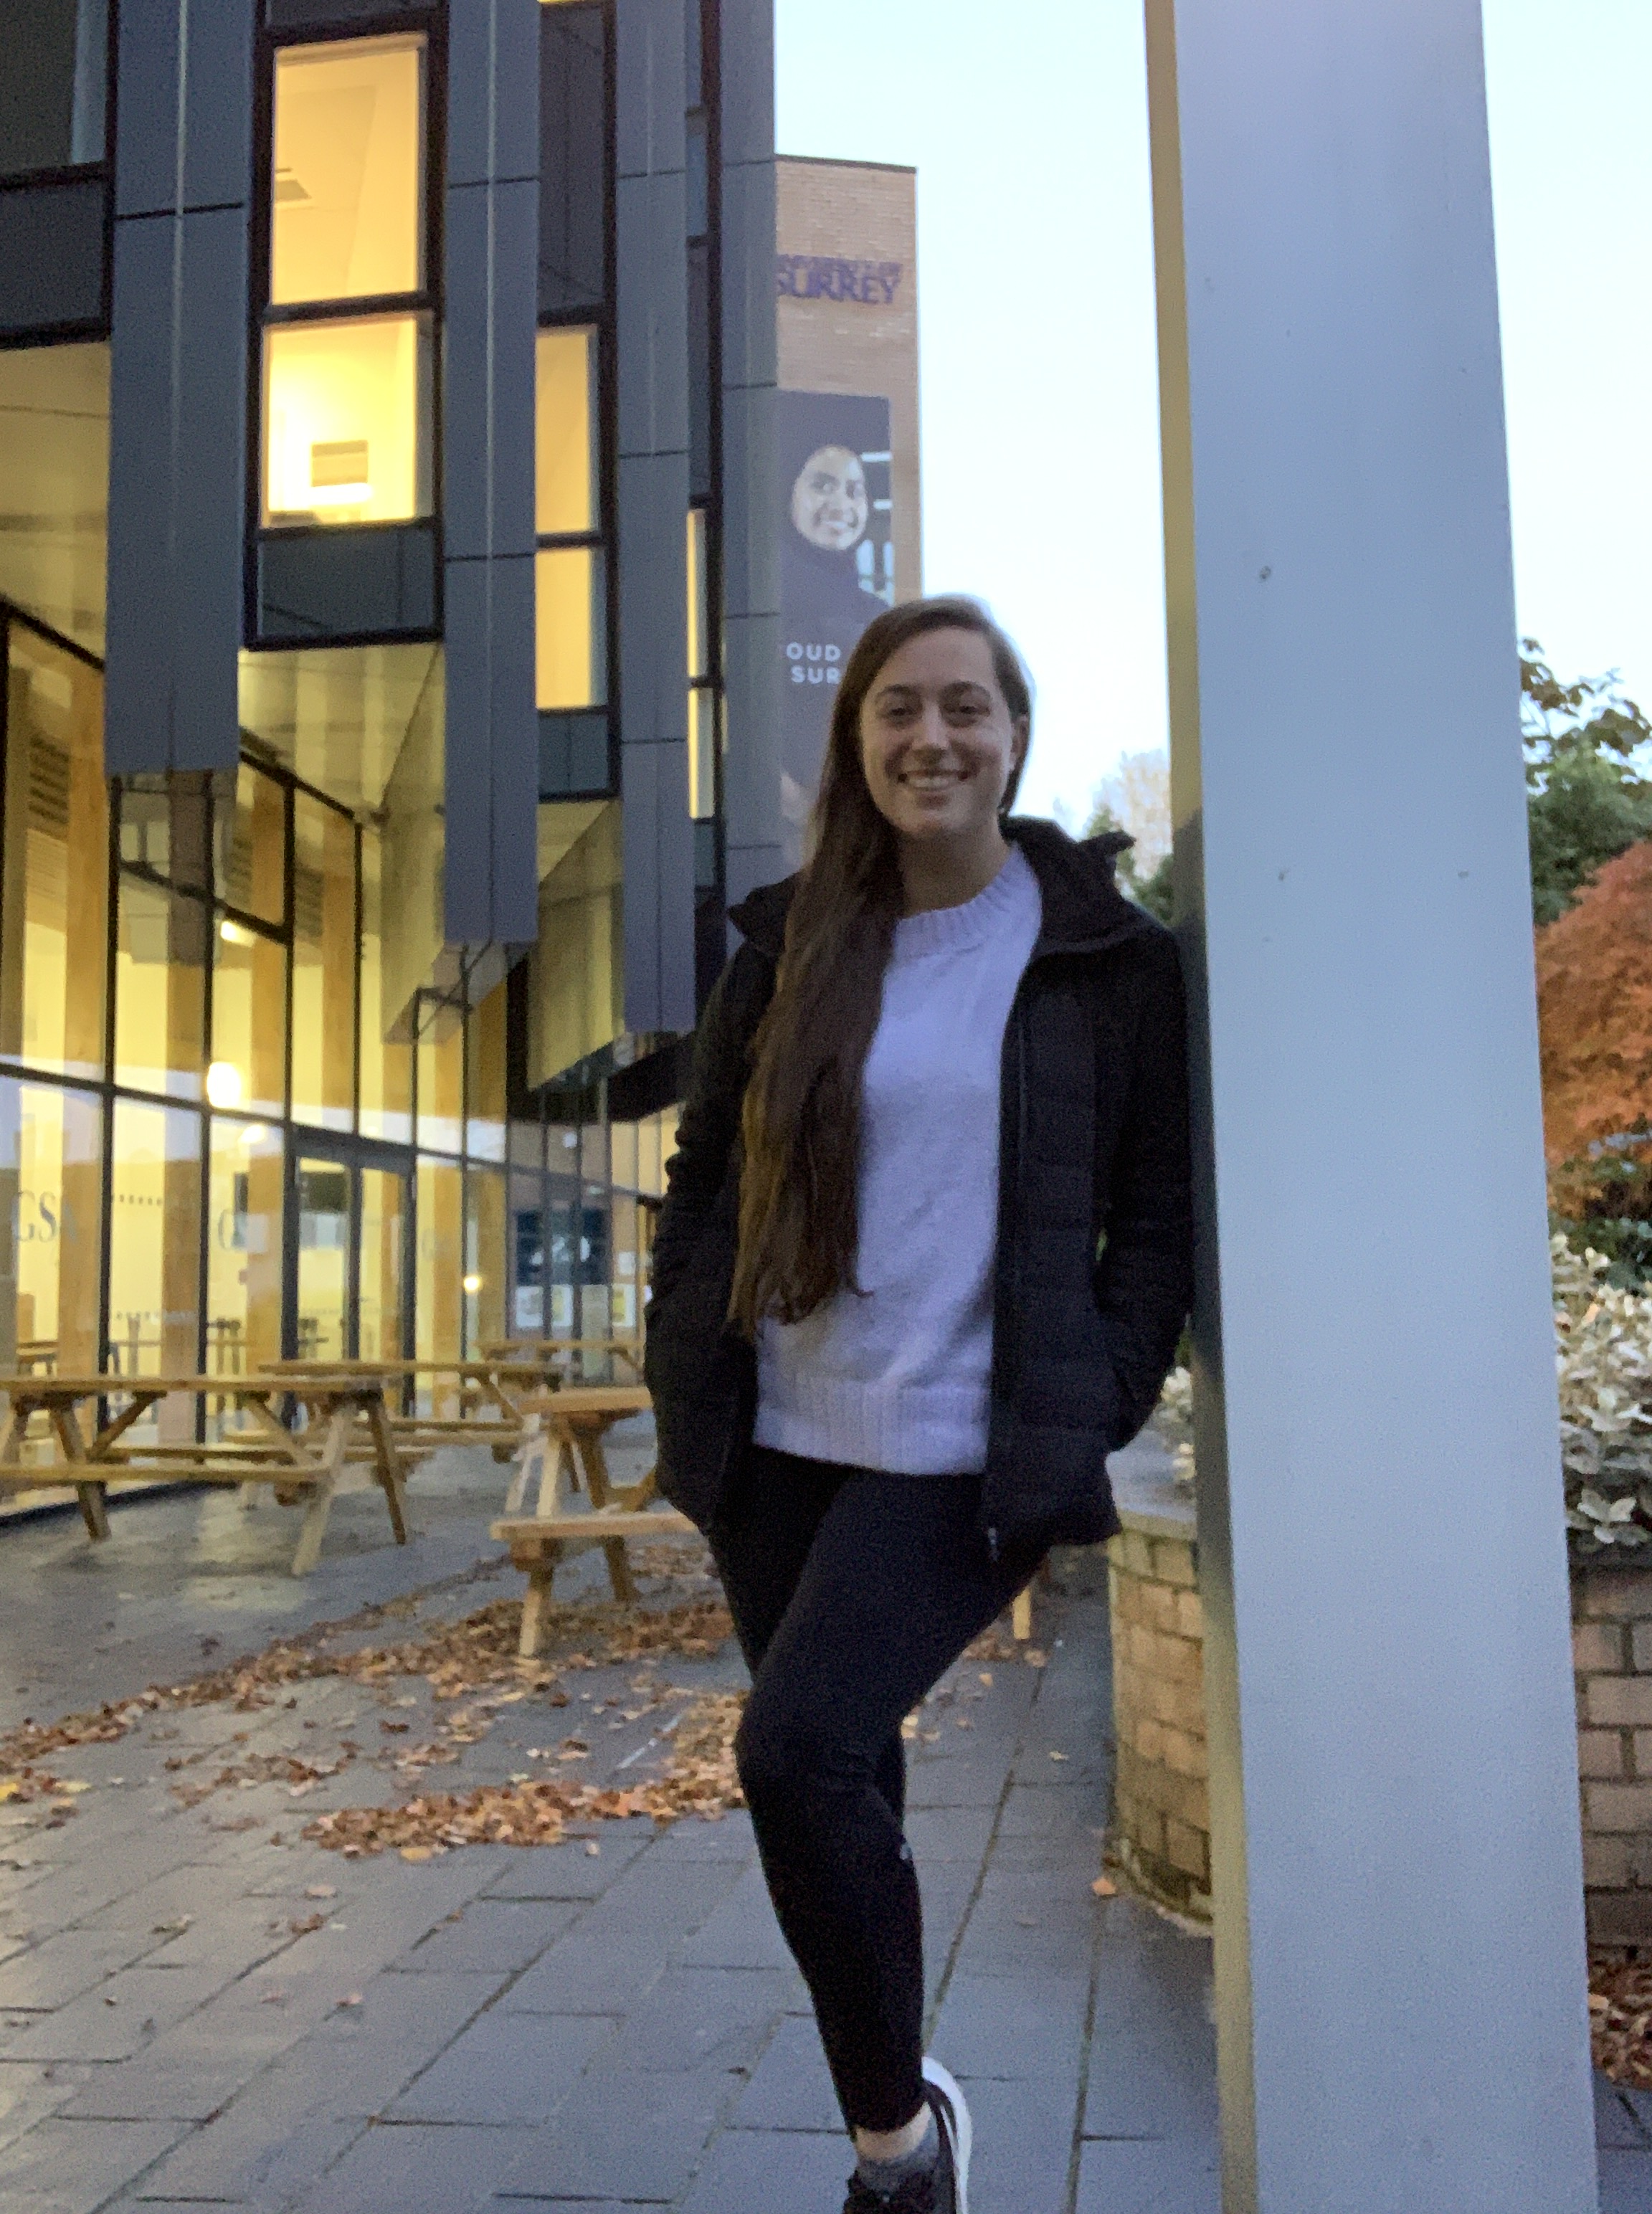
Learn about life at Surrey from a current students from Europe
My life and experience as an international student at Surrey
News from the University of Surrey Library
Updates from the VC’s Office about the work and activities of the President and Vice-Chancellor of the University of Surrey.
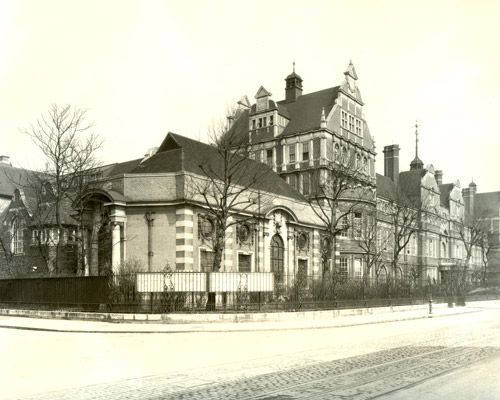
Insights into the archives
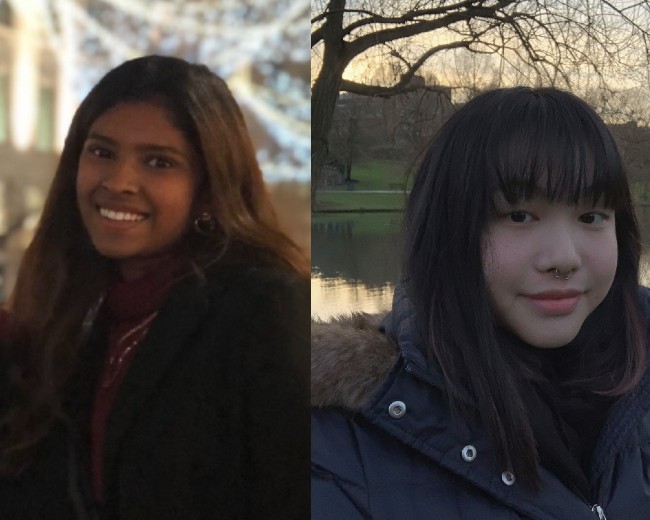
Hear the perspectives of current students from South Asia
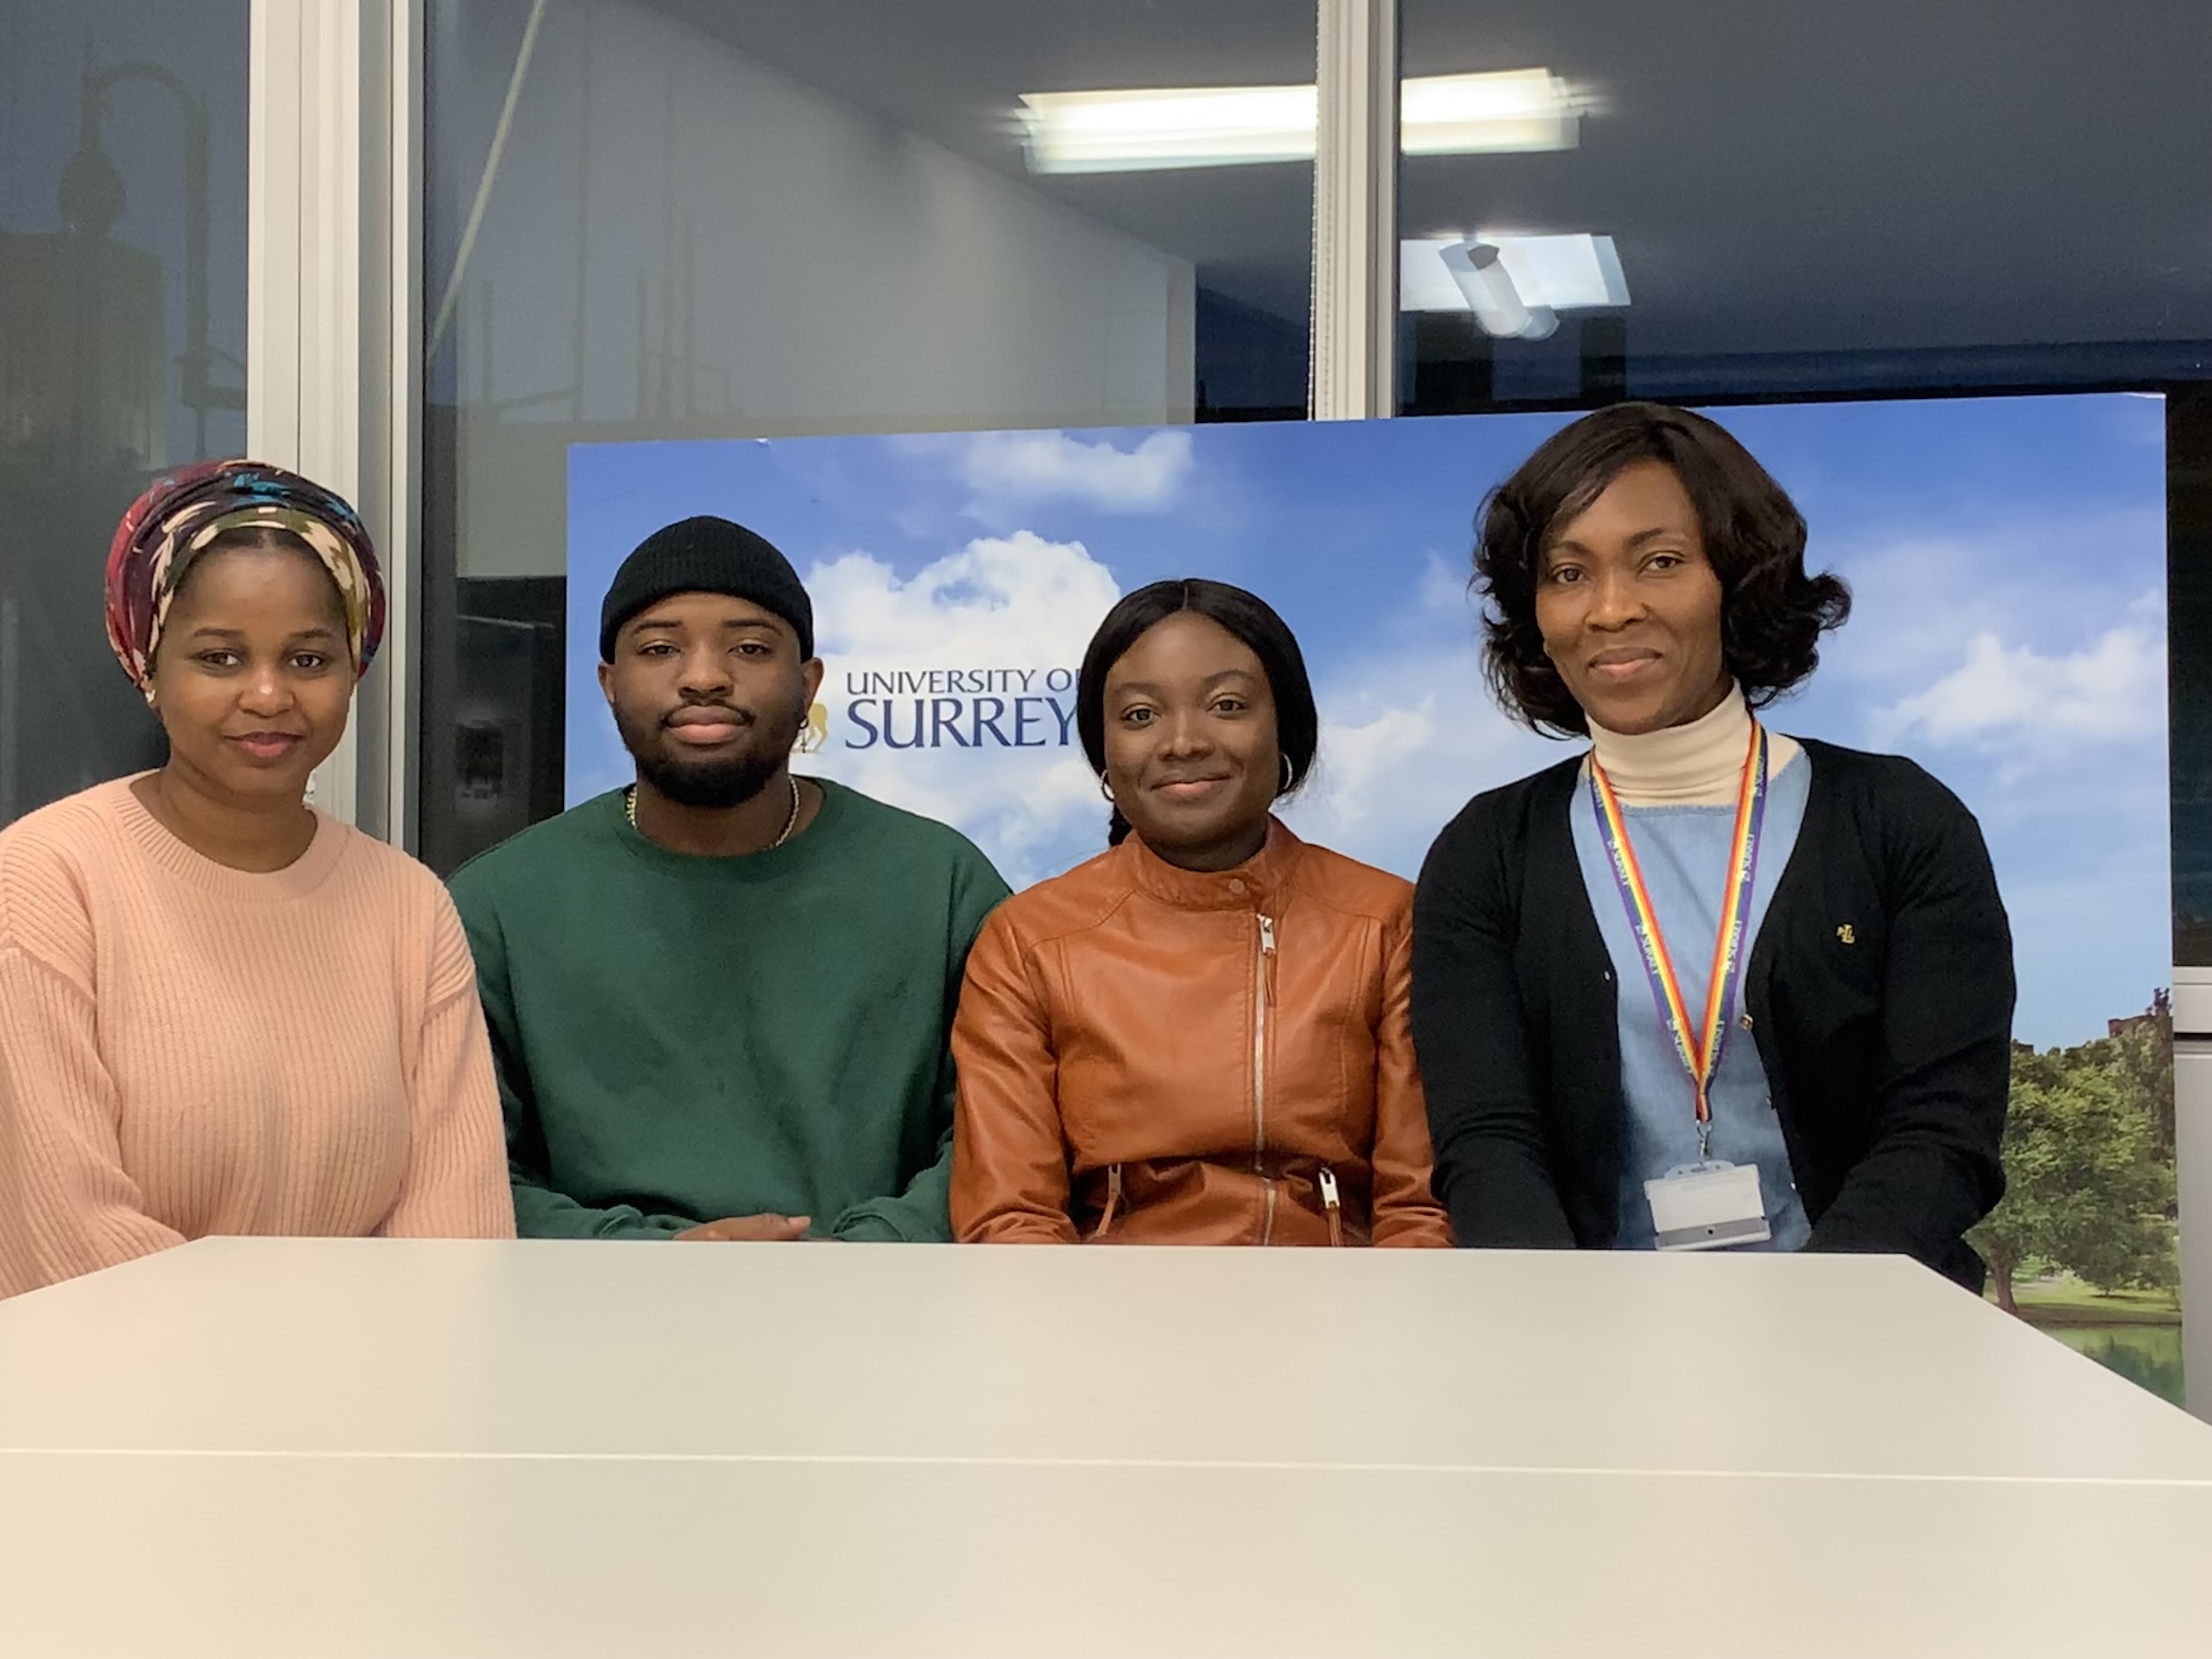
This blog covers the highs and lows of living life as a Nigerian student at the University of Surrey!
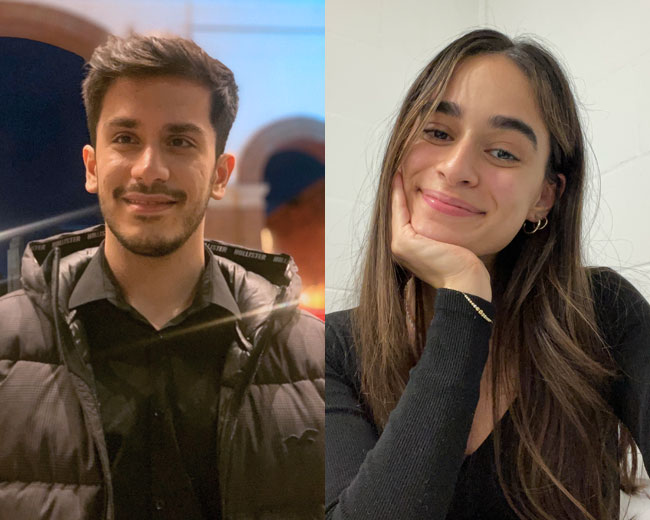
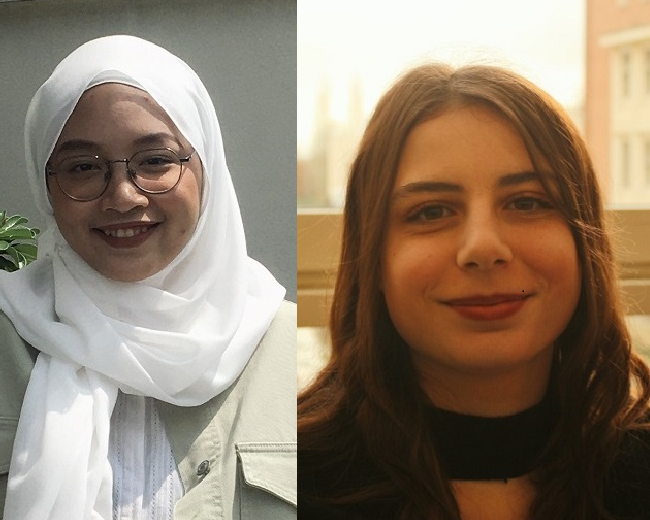
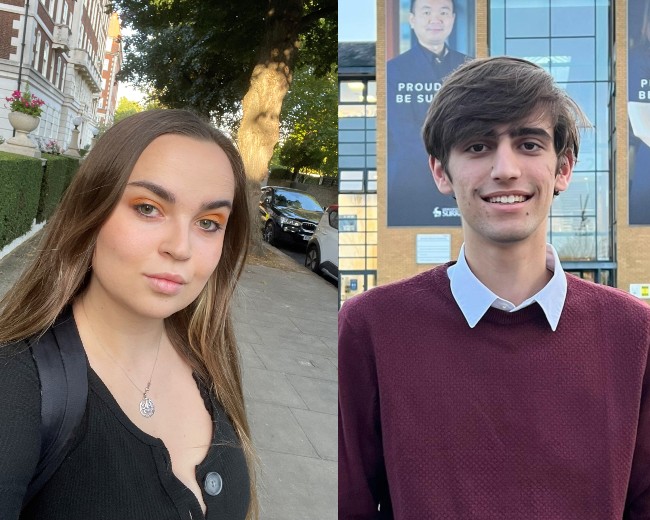
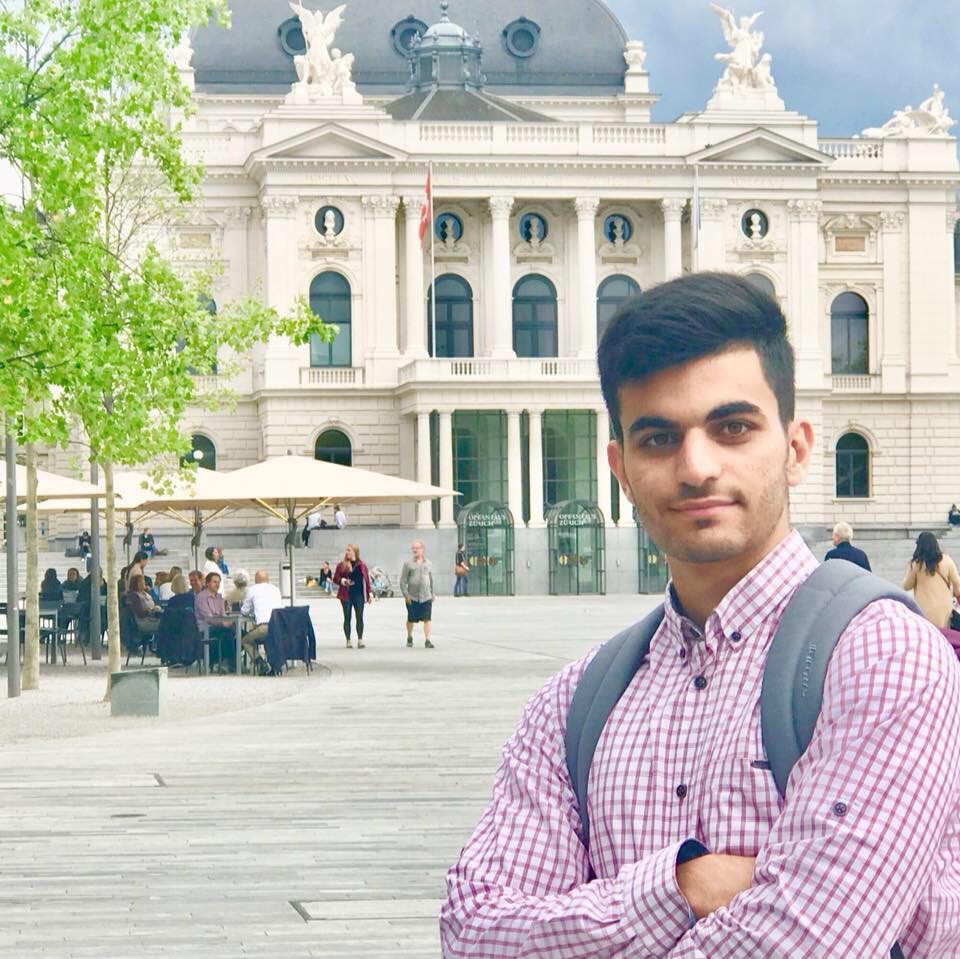
Insight into life at Surrey from three current Middle Eastern students

Where members of our Executive Board and staff share their opinions on the latest issues.
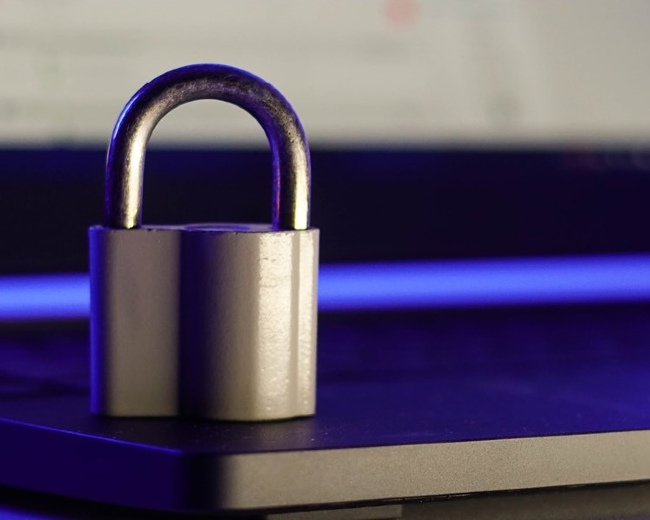
The latest from the cyber security team
Follow our current students through their Professional Training placements.
An insight into life at Surrey from a current Canadian student
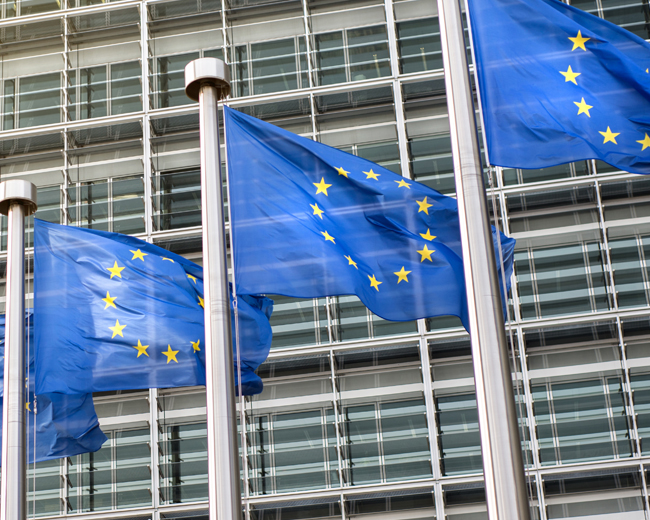
All the latest British and European politics news.
Learn about life at Surrey from one of current Spanish students
Documenting the experiences of nursing students at Surrey

Discover more about what it's like to be a postgraduate student at Surrey.
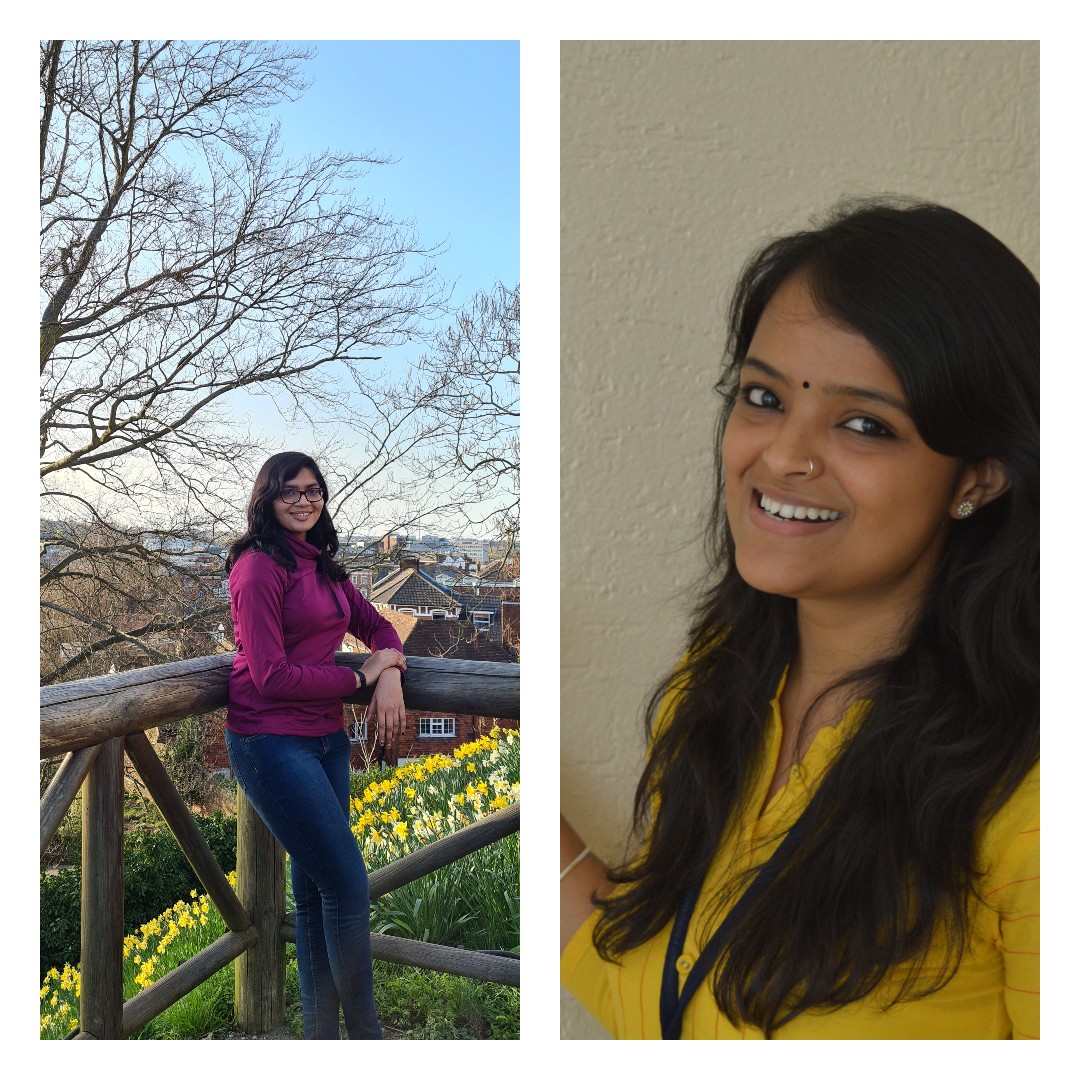
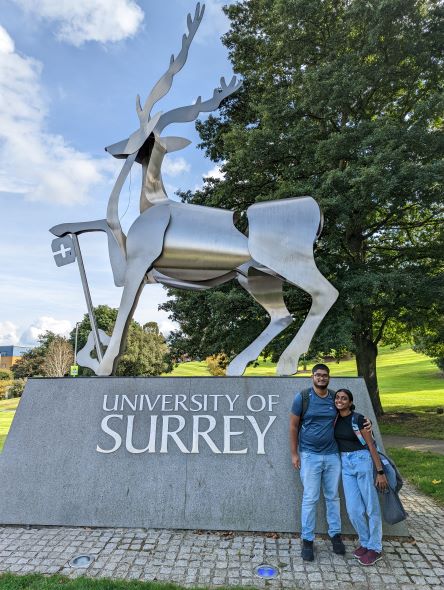
An insight into life at Surrey from three current Indian students.

Staff and trainees share their thoughts, projects, resources, and publications on increasing inclusivity and representation within clinical psychology training and practice

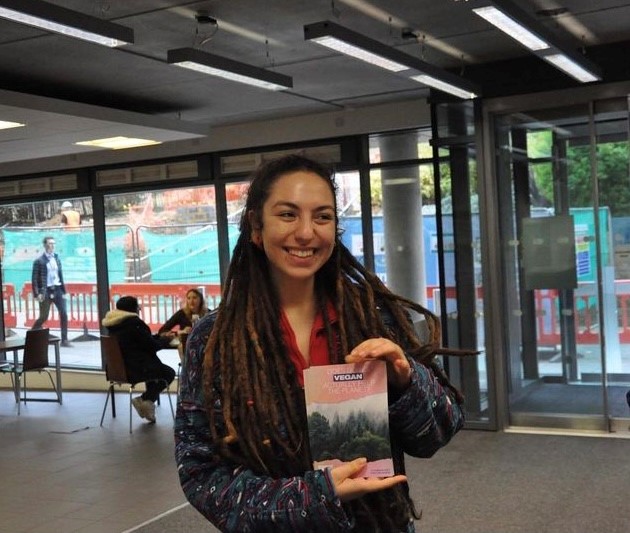
The blog of the Centre for Environment and Sustainability at the University of Surrey.
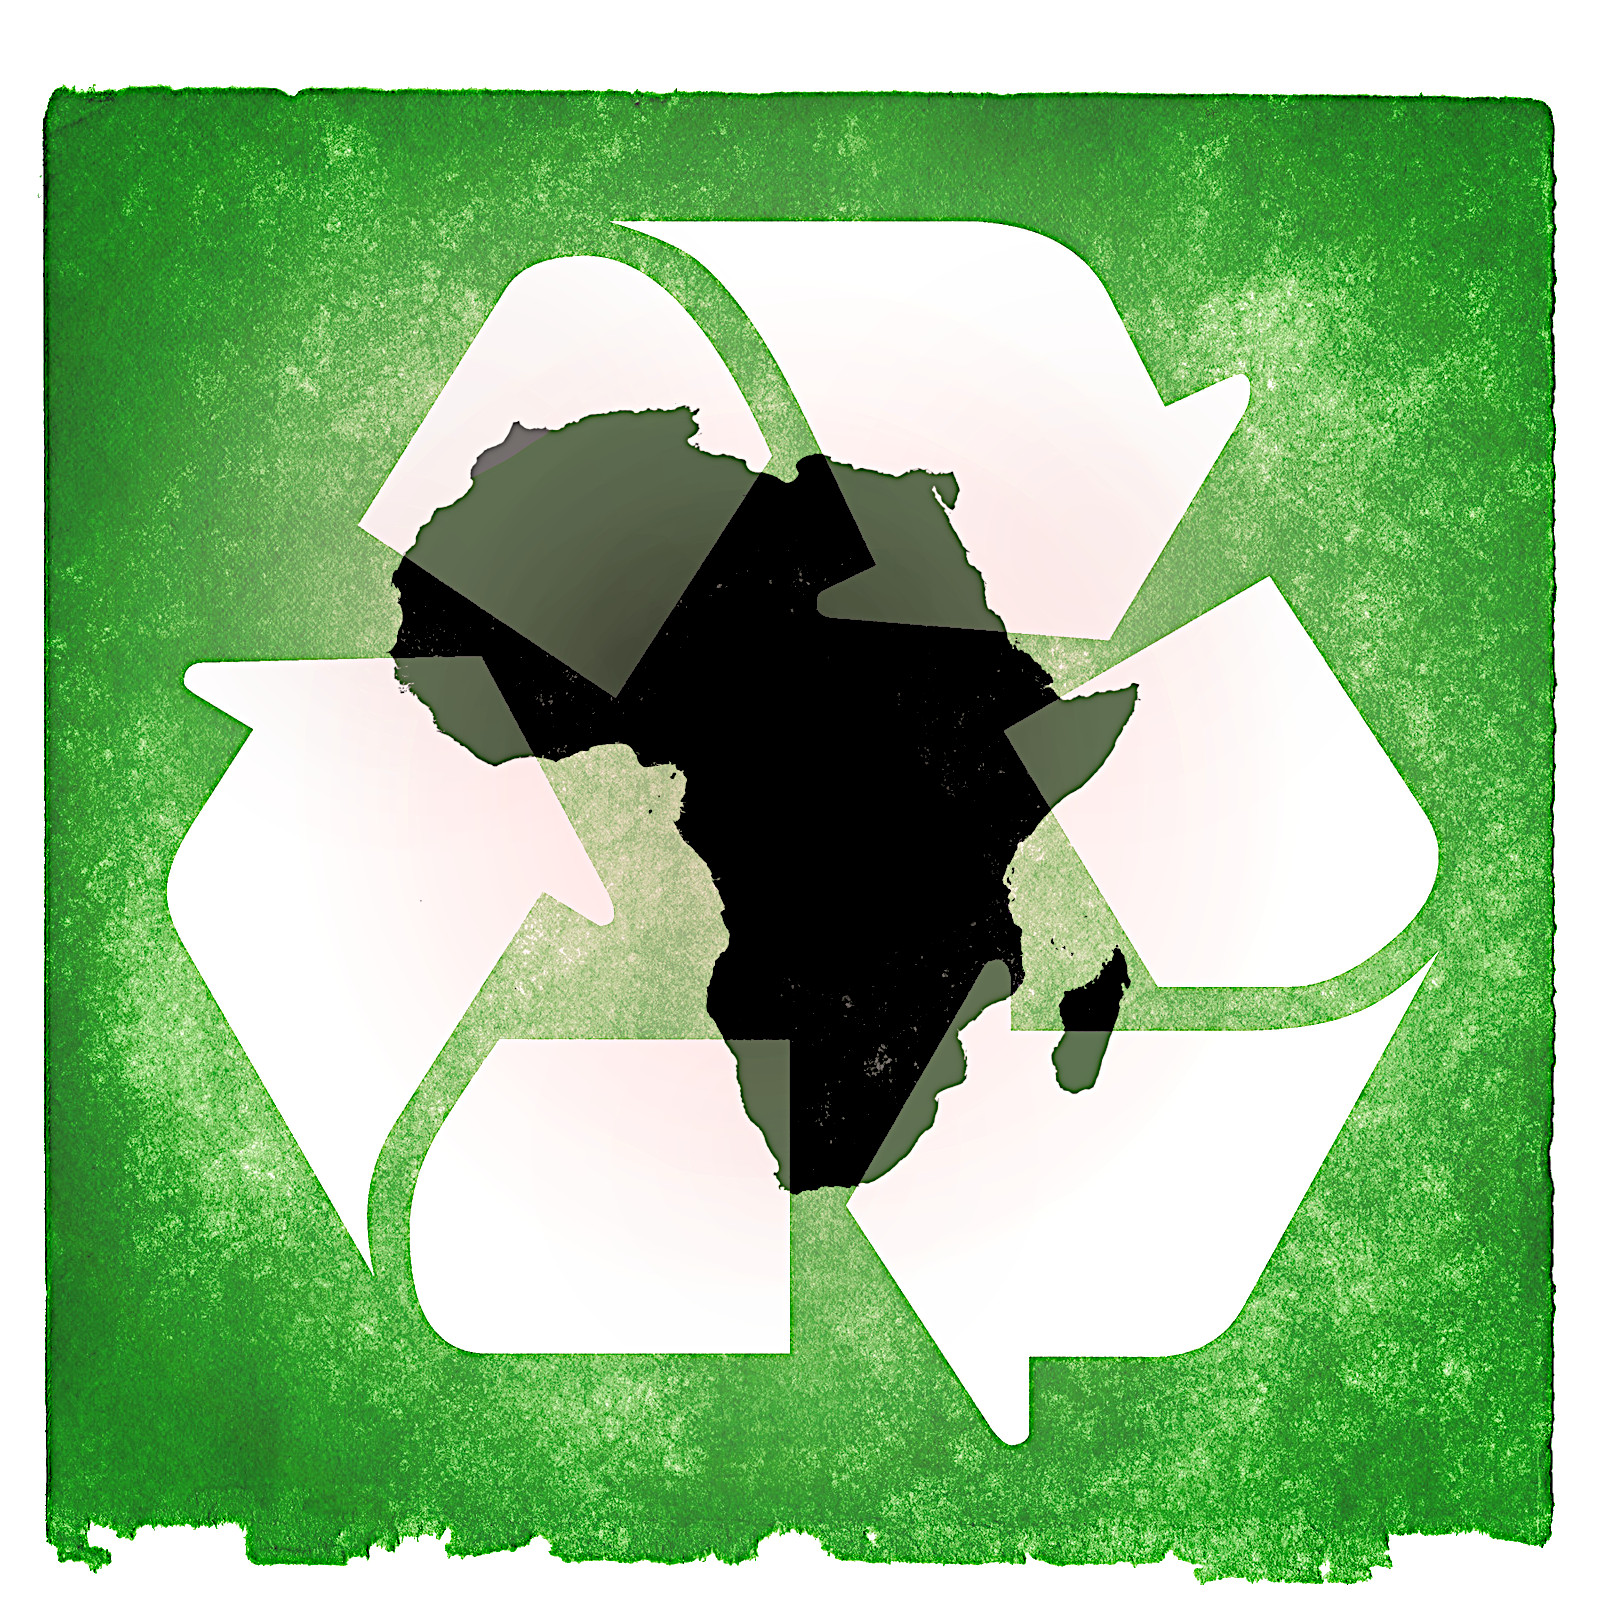
Updates and insights from the war against plastic in seven developing nations
The latest news and updates from the postgraduate research (PGR) and early career researcher (ECR) community at the University of Surrey
Members of the CoGDeV lab share their research findings, research experiences, news and events summaries.
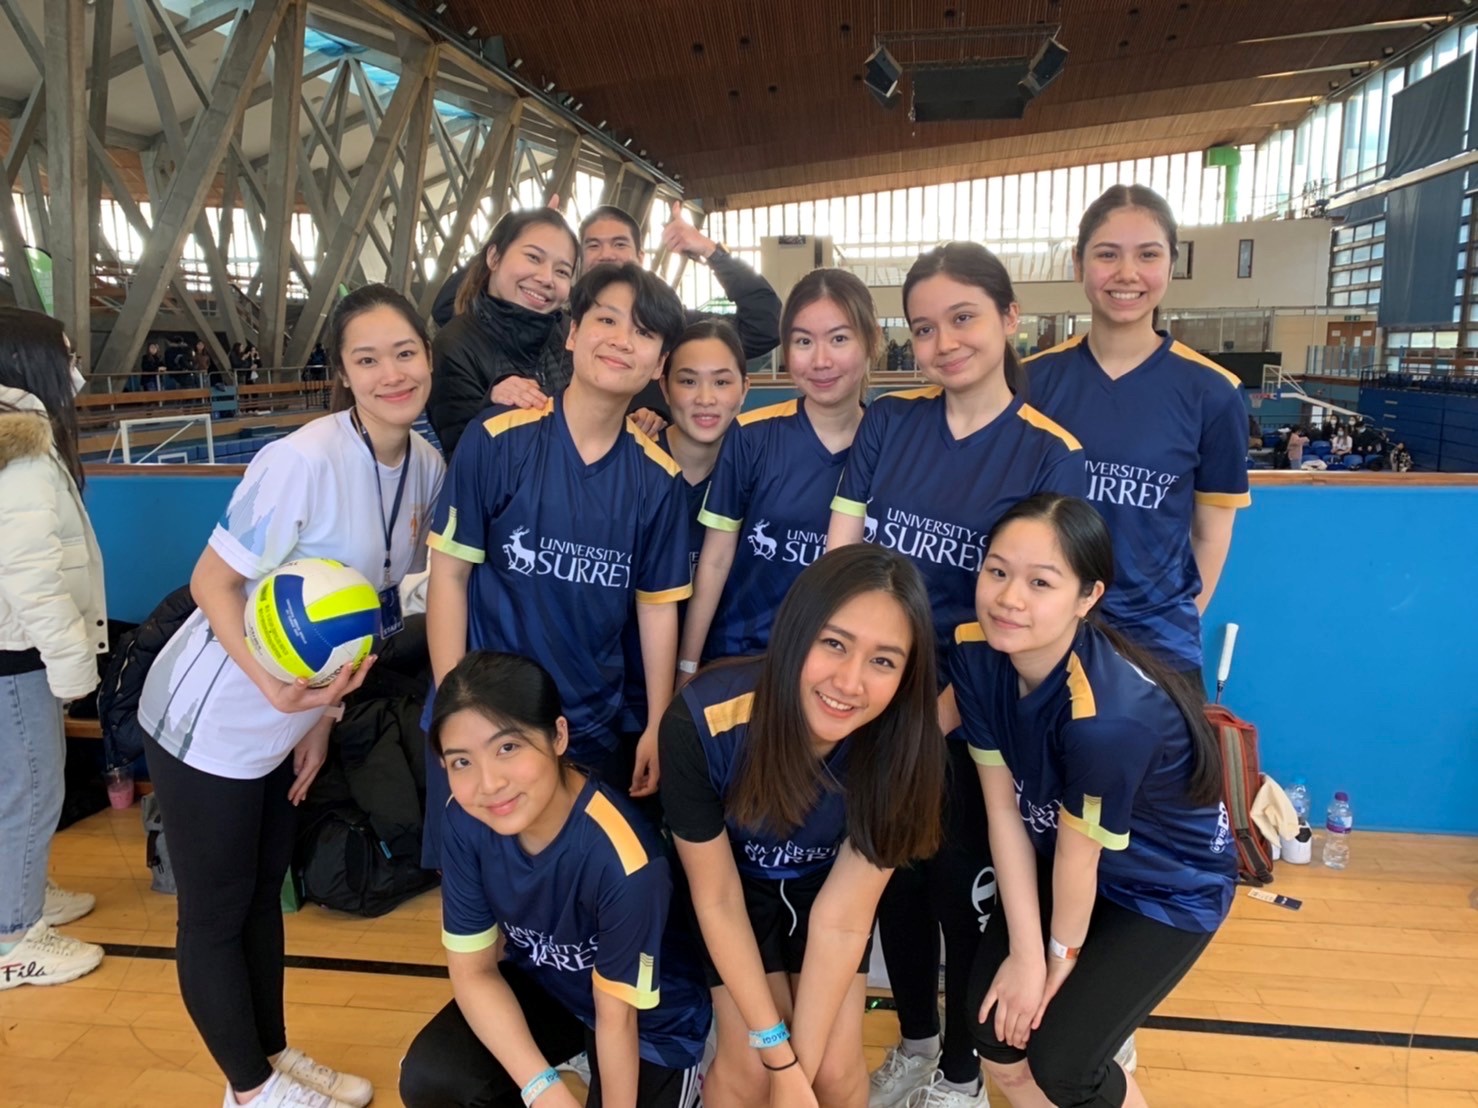
An insight into life at Surrey from a current Thai student
Learn about life at Surrey from a current Cypriot student

Empower and accelerate your career with data-driven insights
An insight into life at Surrey from a current Taiwanese student
The blog of the Department of Politics at the University of Surrey
Sharing staff, student and alumni perspectives and understanding of racism, and their process of learning and unlearning in moving towards an anti-racist society
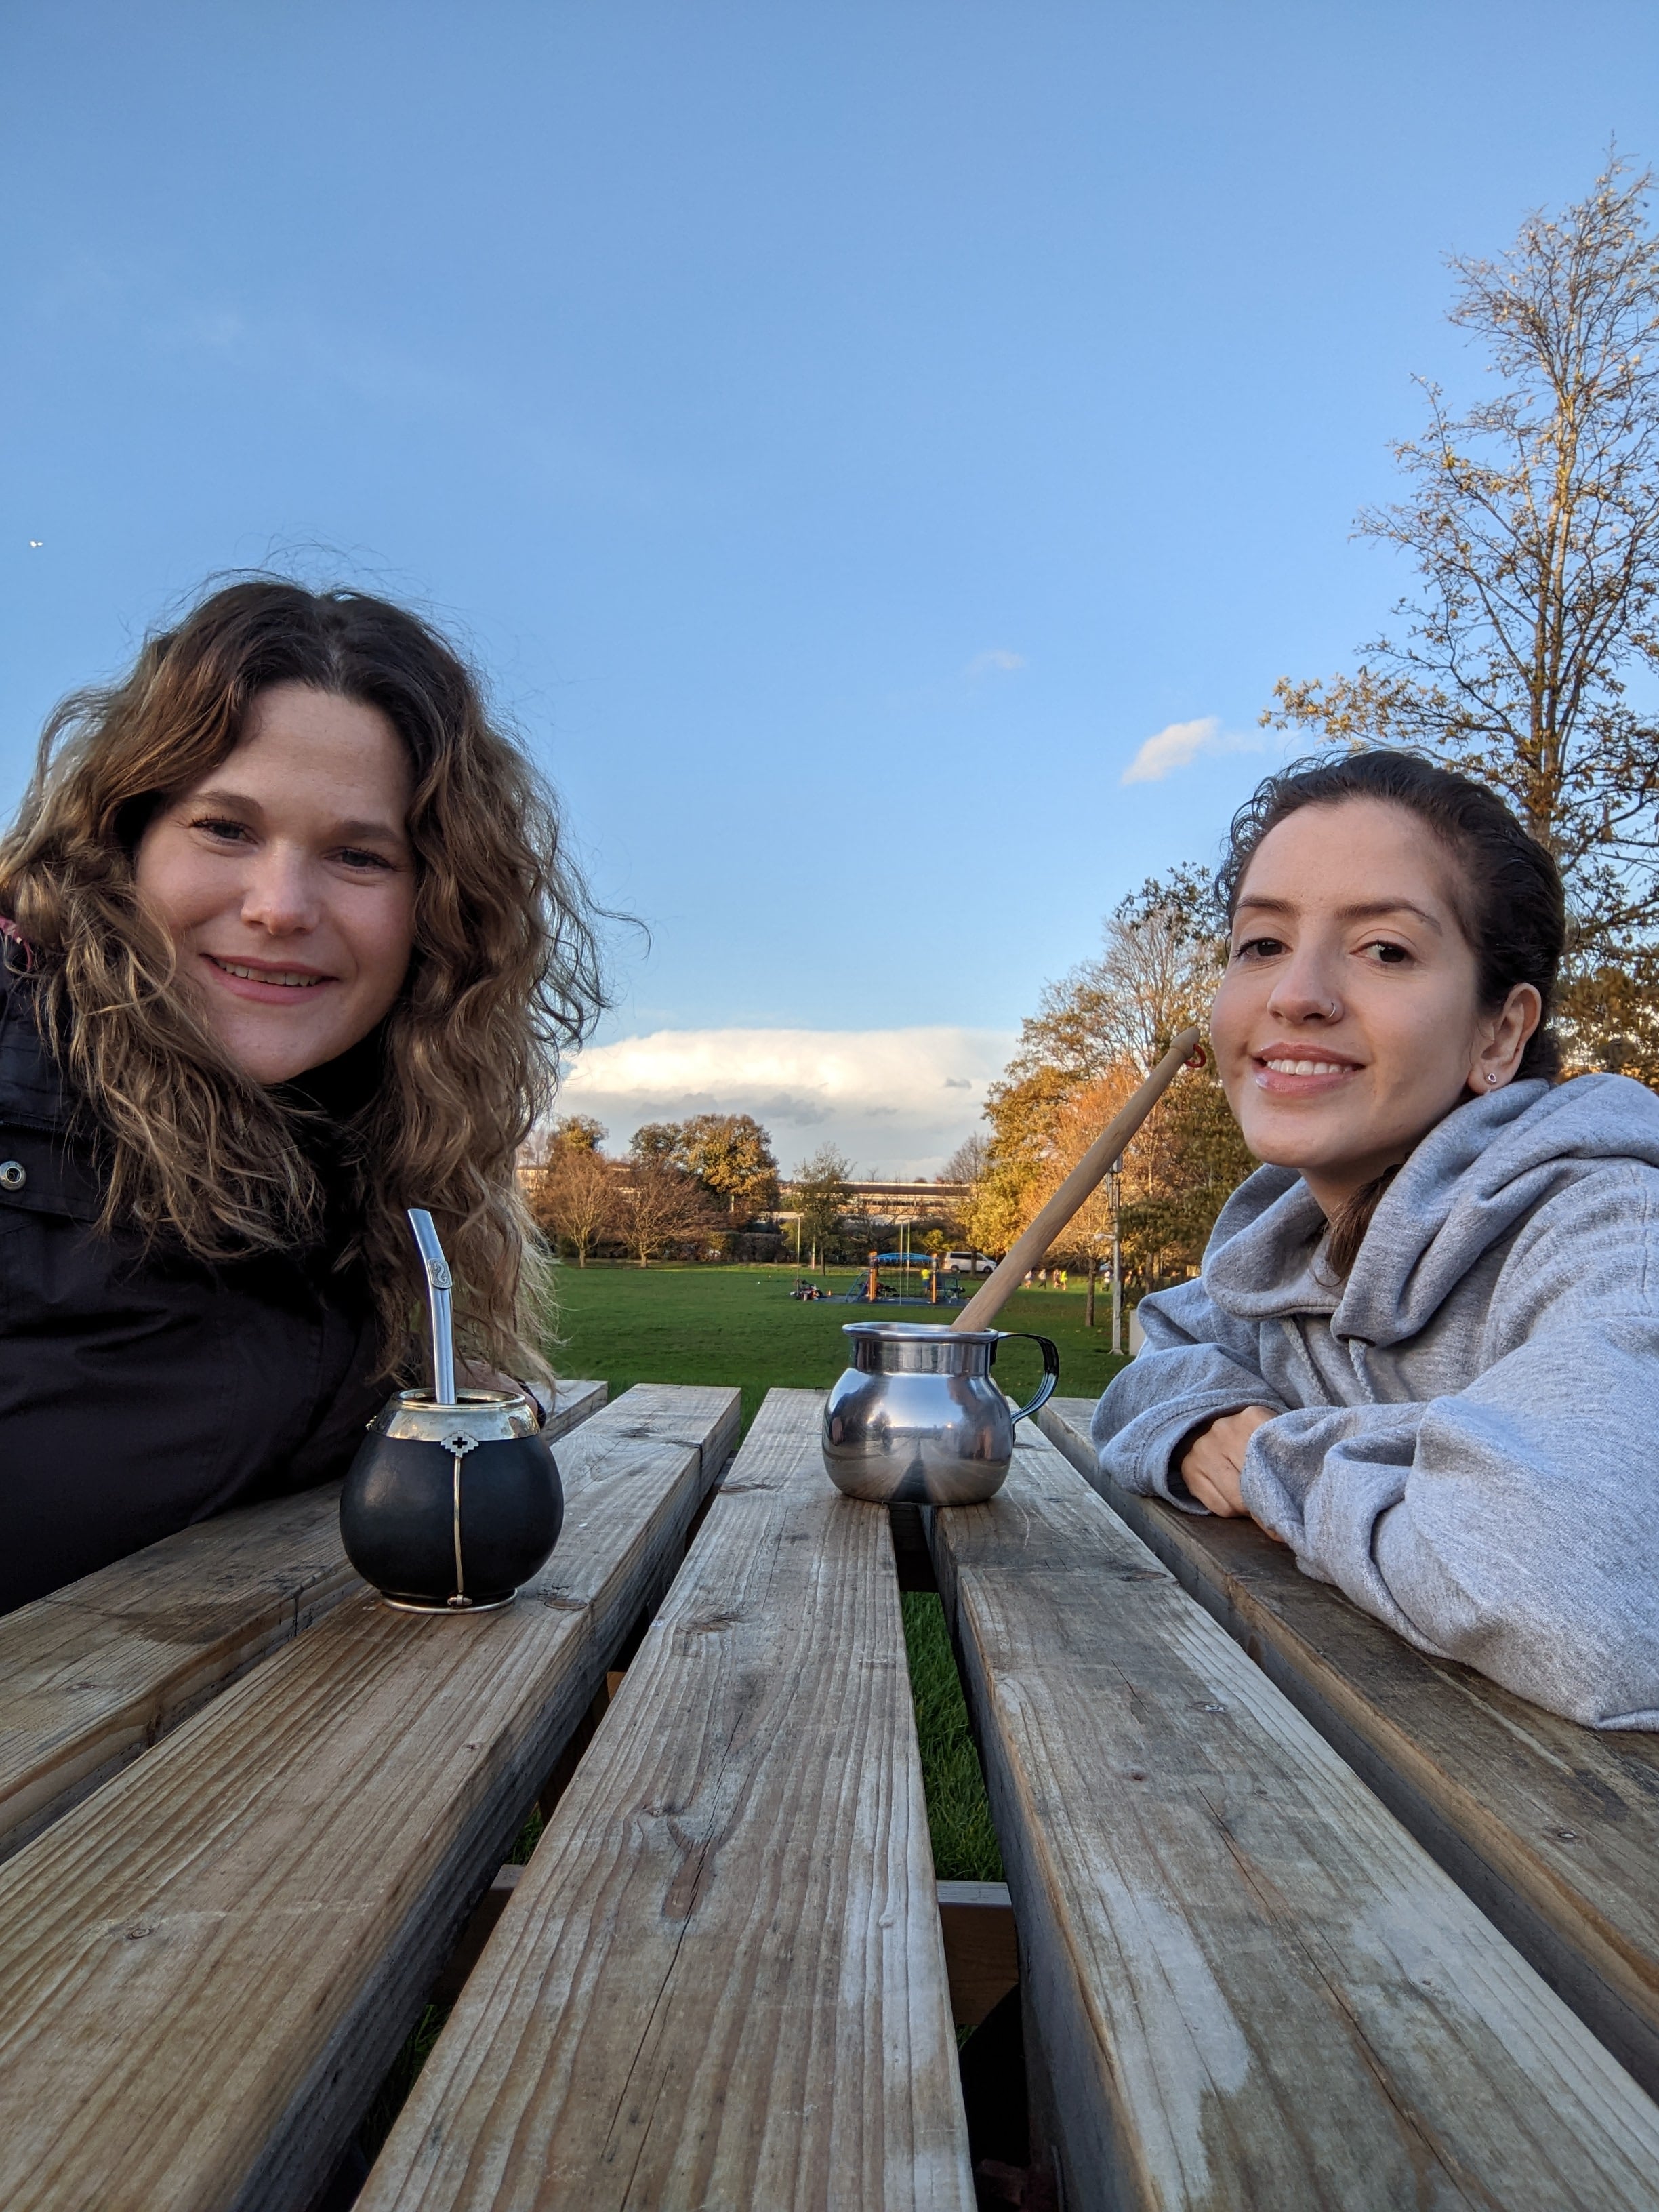
An insight into life at Surrey from a current Latin American student

Our aim is to raise awareness and to stimulate reflection and debate on topics related to ethics and care.
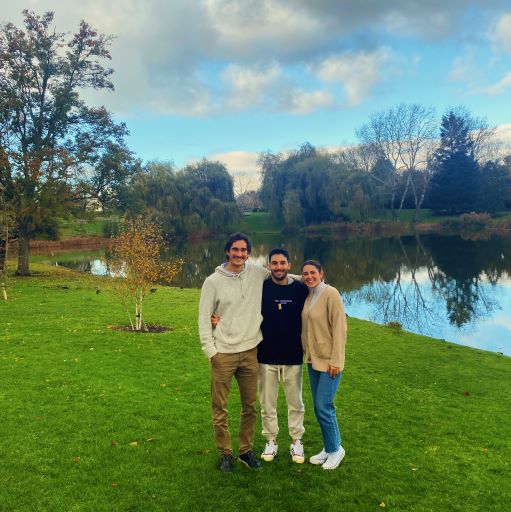
An insight into life at Surrey from current exchange students
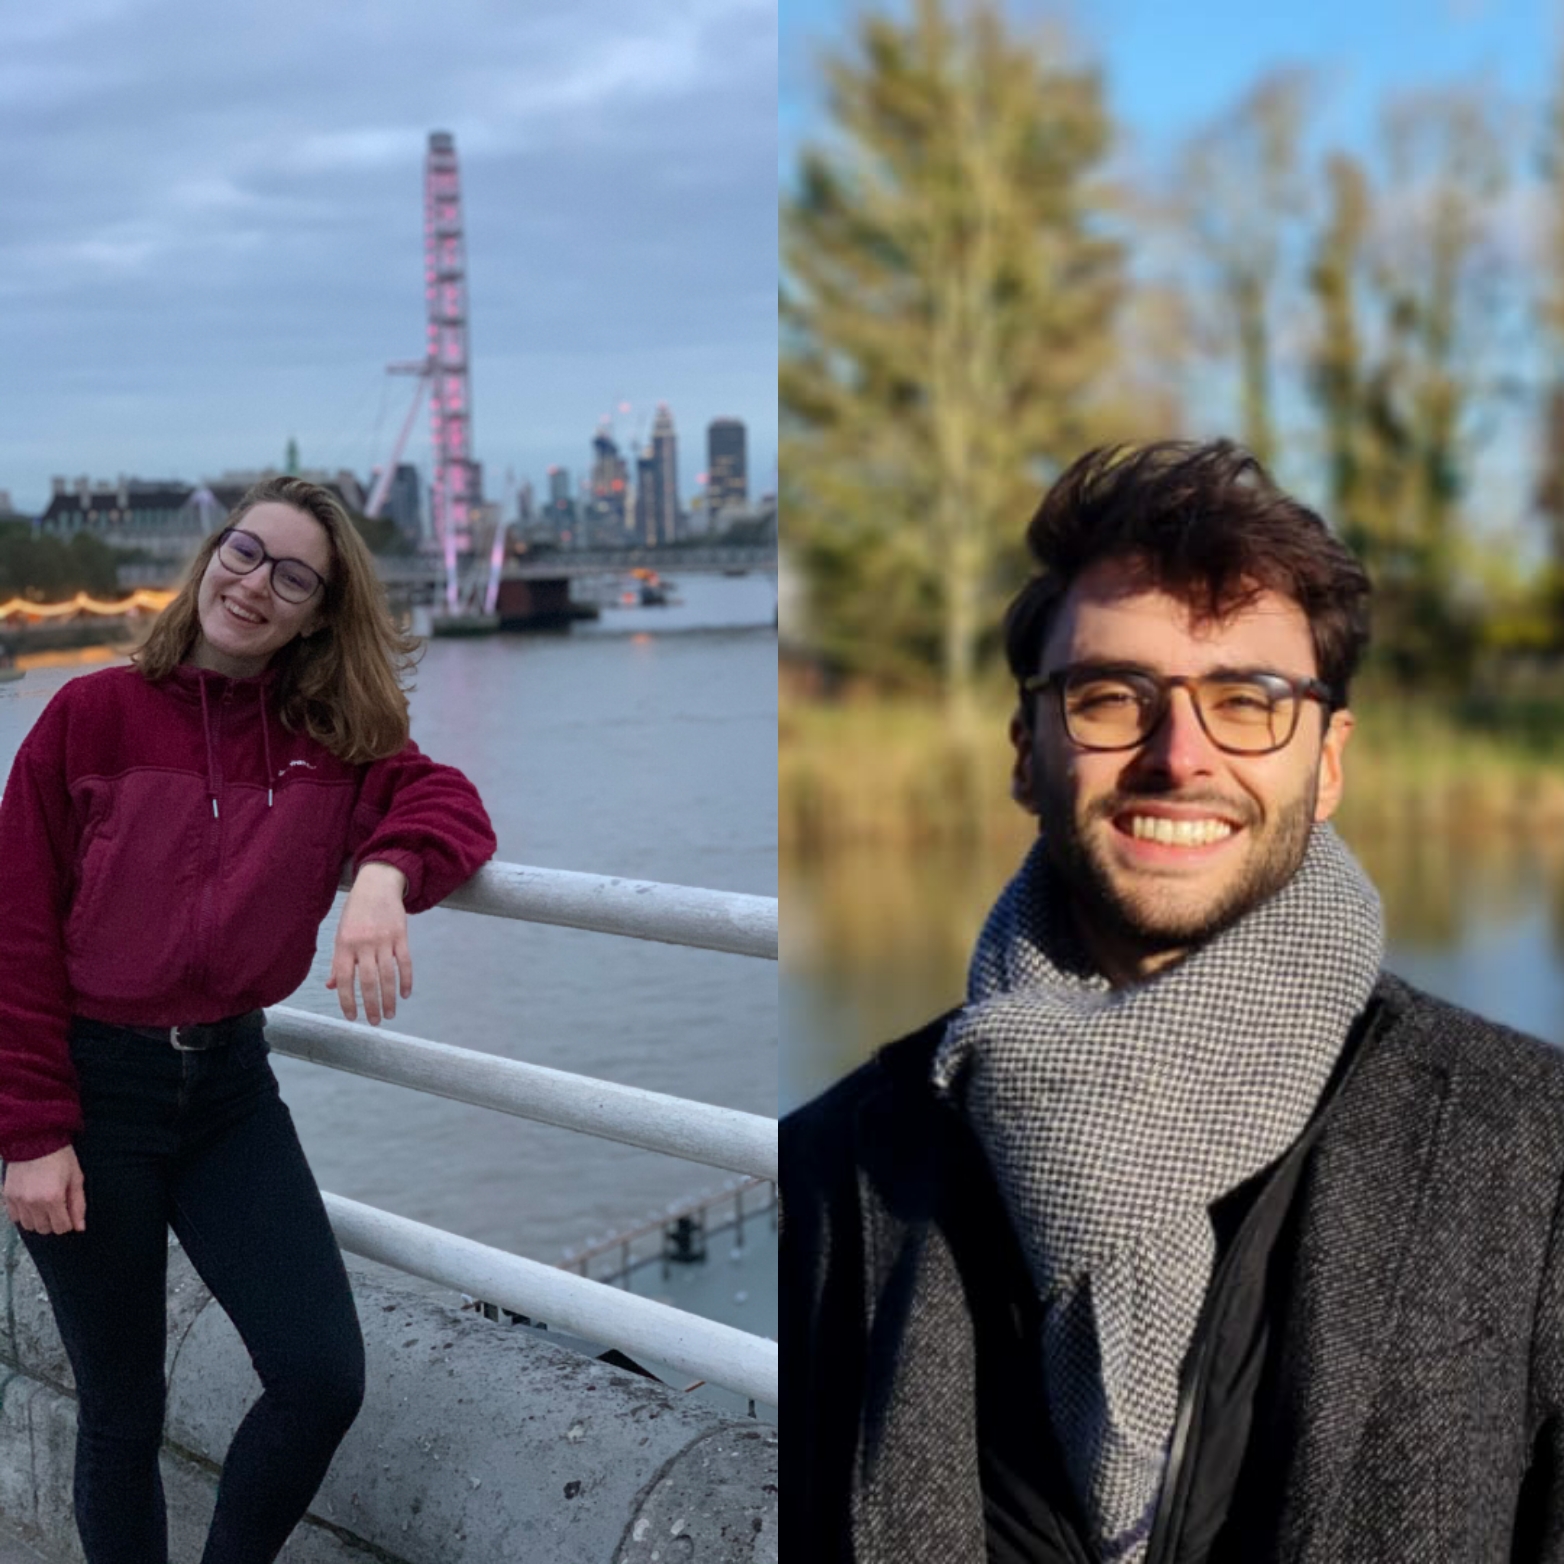
Learn about life at Surrey from two current Greek students

Learn about life at Surrey from a current student from France

The blog about physics at the University of Surrey
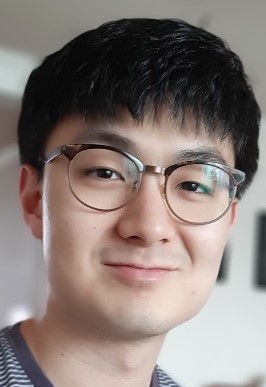
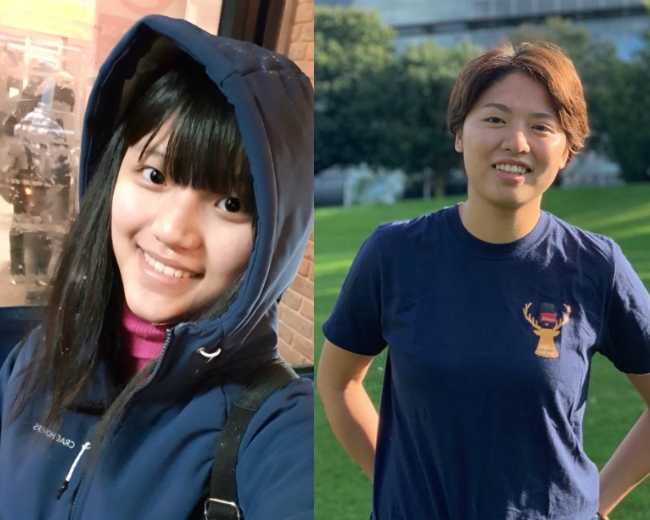
Hear the perspective of a current South Korean student
Learn about life at Surrey from a current students from Italy
An insight into life at Surrey from current US students
Connect with our insight, ideas and latest projects

Find out more about neurodiversity at Surrey from neurodivergent staff, students and alumni
An insight into life at Surrey from a current Turkish student

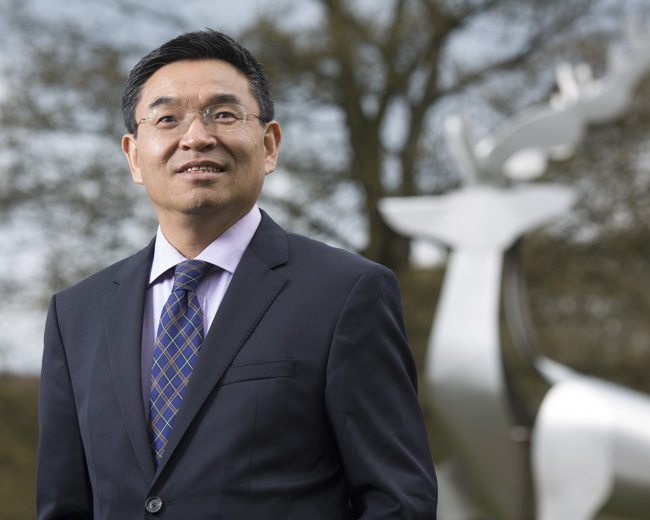
Welcome to the international Forum! This page hosts a range of outputs, including blogs, vlogs and podcasts that reflect my thoughts in relation to my role as Dean International. This will include global trends in both foreign affairs and higher education, post-Brexit changes as they impact students and educators, the UK’s relations with Europe and the world 2021+, and the new partnership initiatives being undertaken by the University of Surrey with universities around the world.
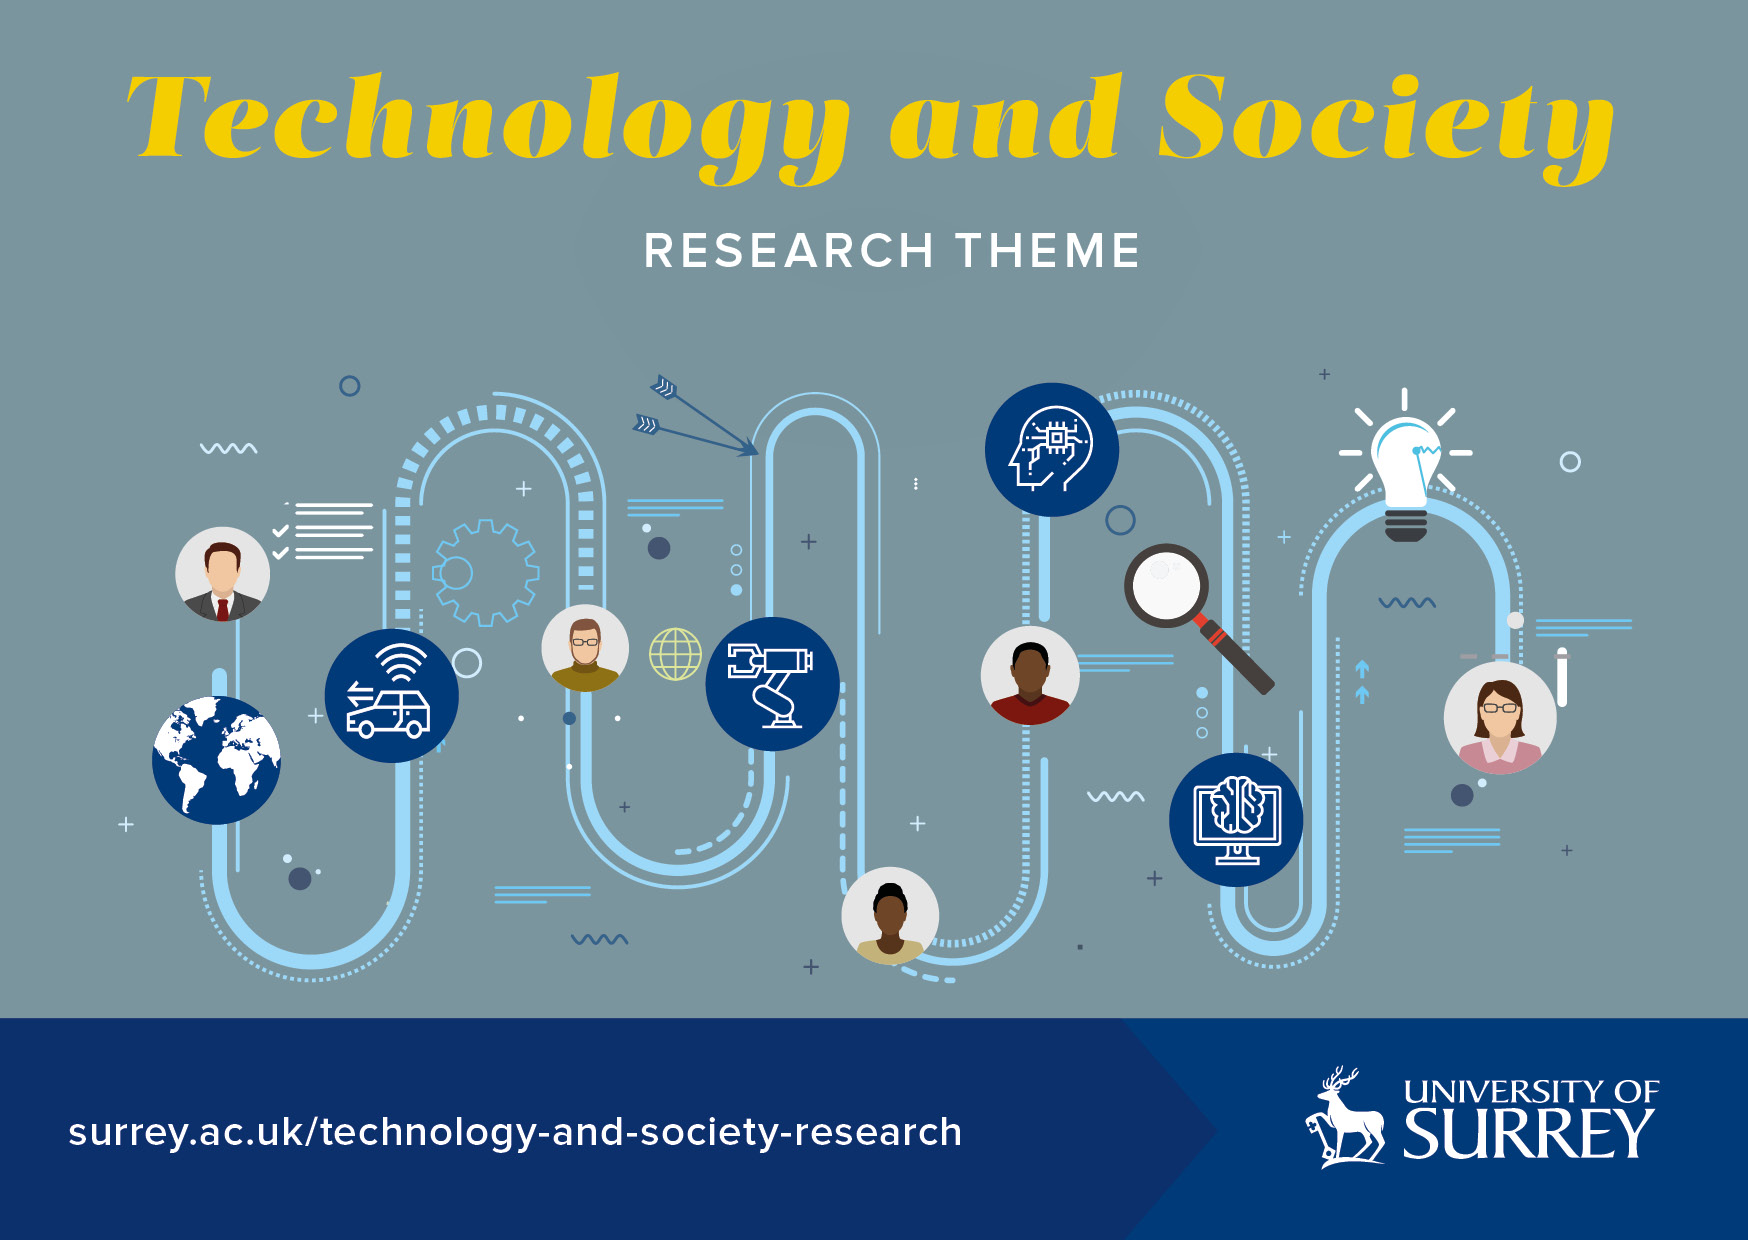
Spotlights and showcases from the University of Surrey's Strategic Research Theme Technology and Society
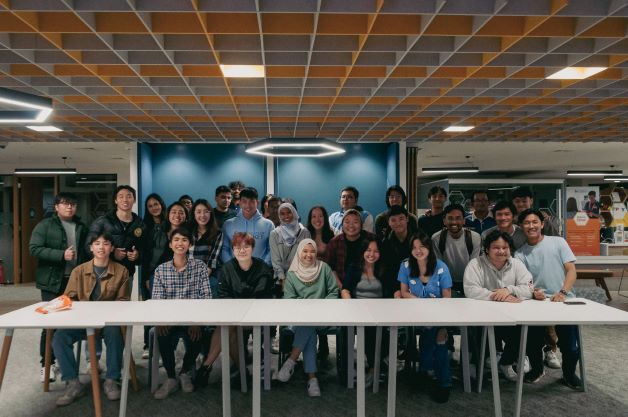
An insight into life at Surrey from a current Indonesian student

The latest news, updates and insights from the Centre for Education Management.
The diversity of backgrounds and careers of those who study physics.
Women's Literary Culture Before the Conquest
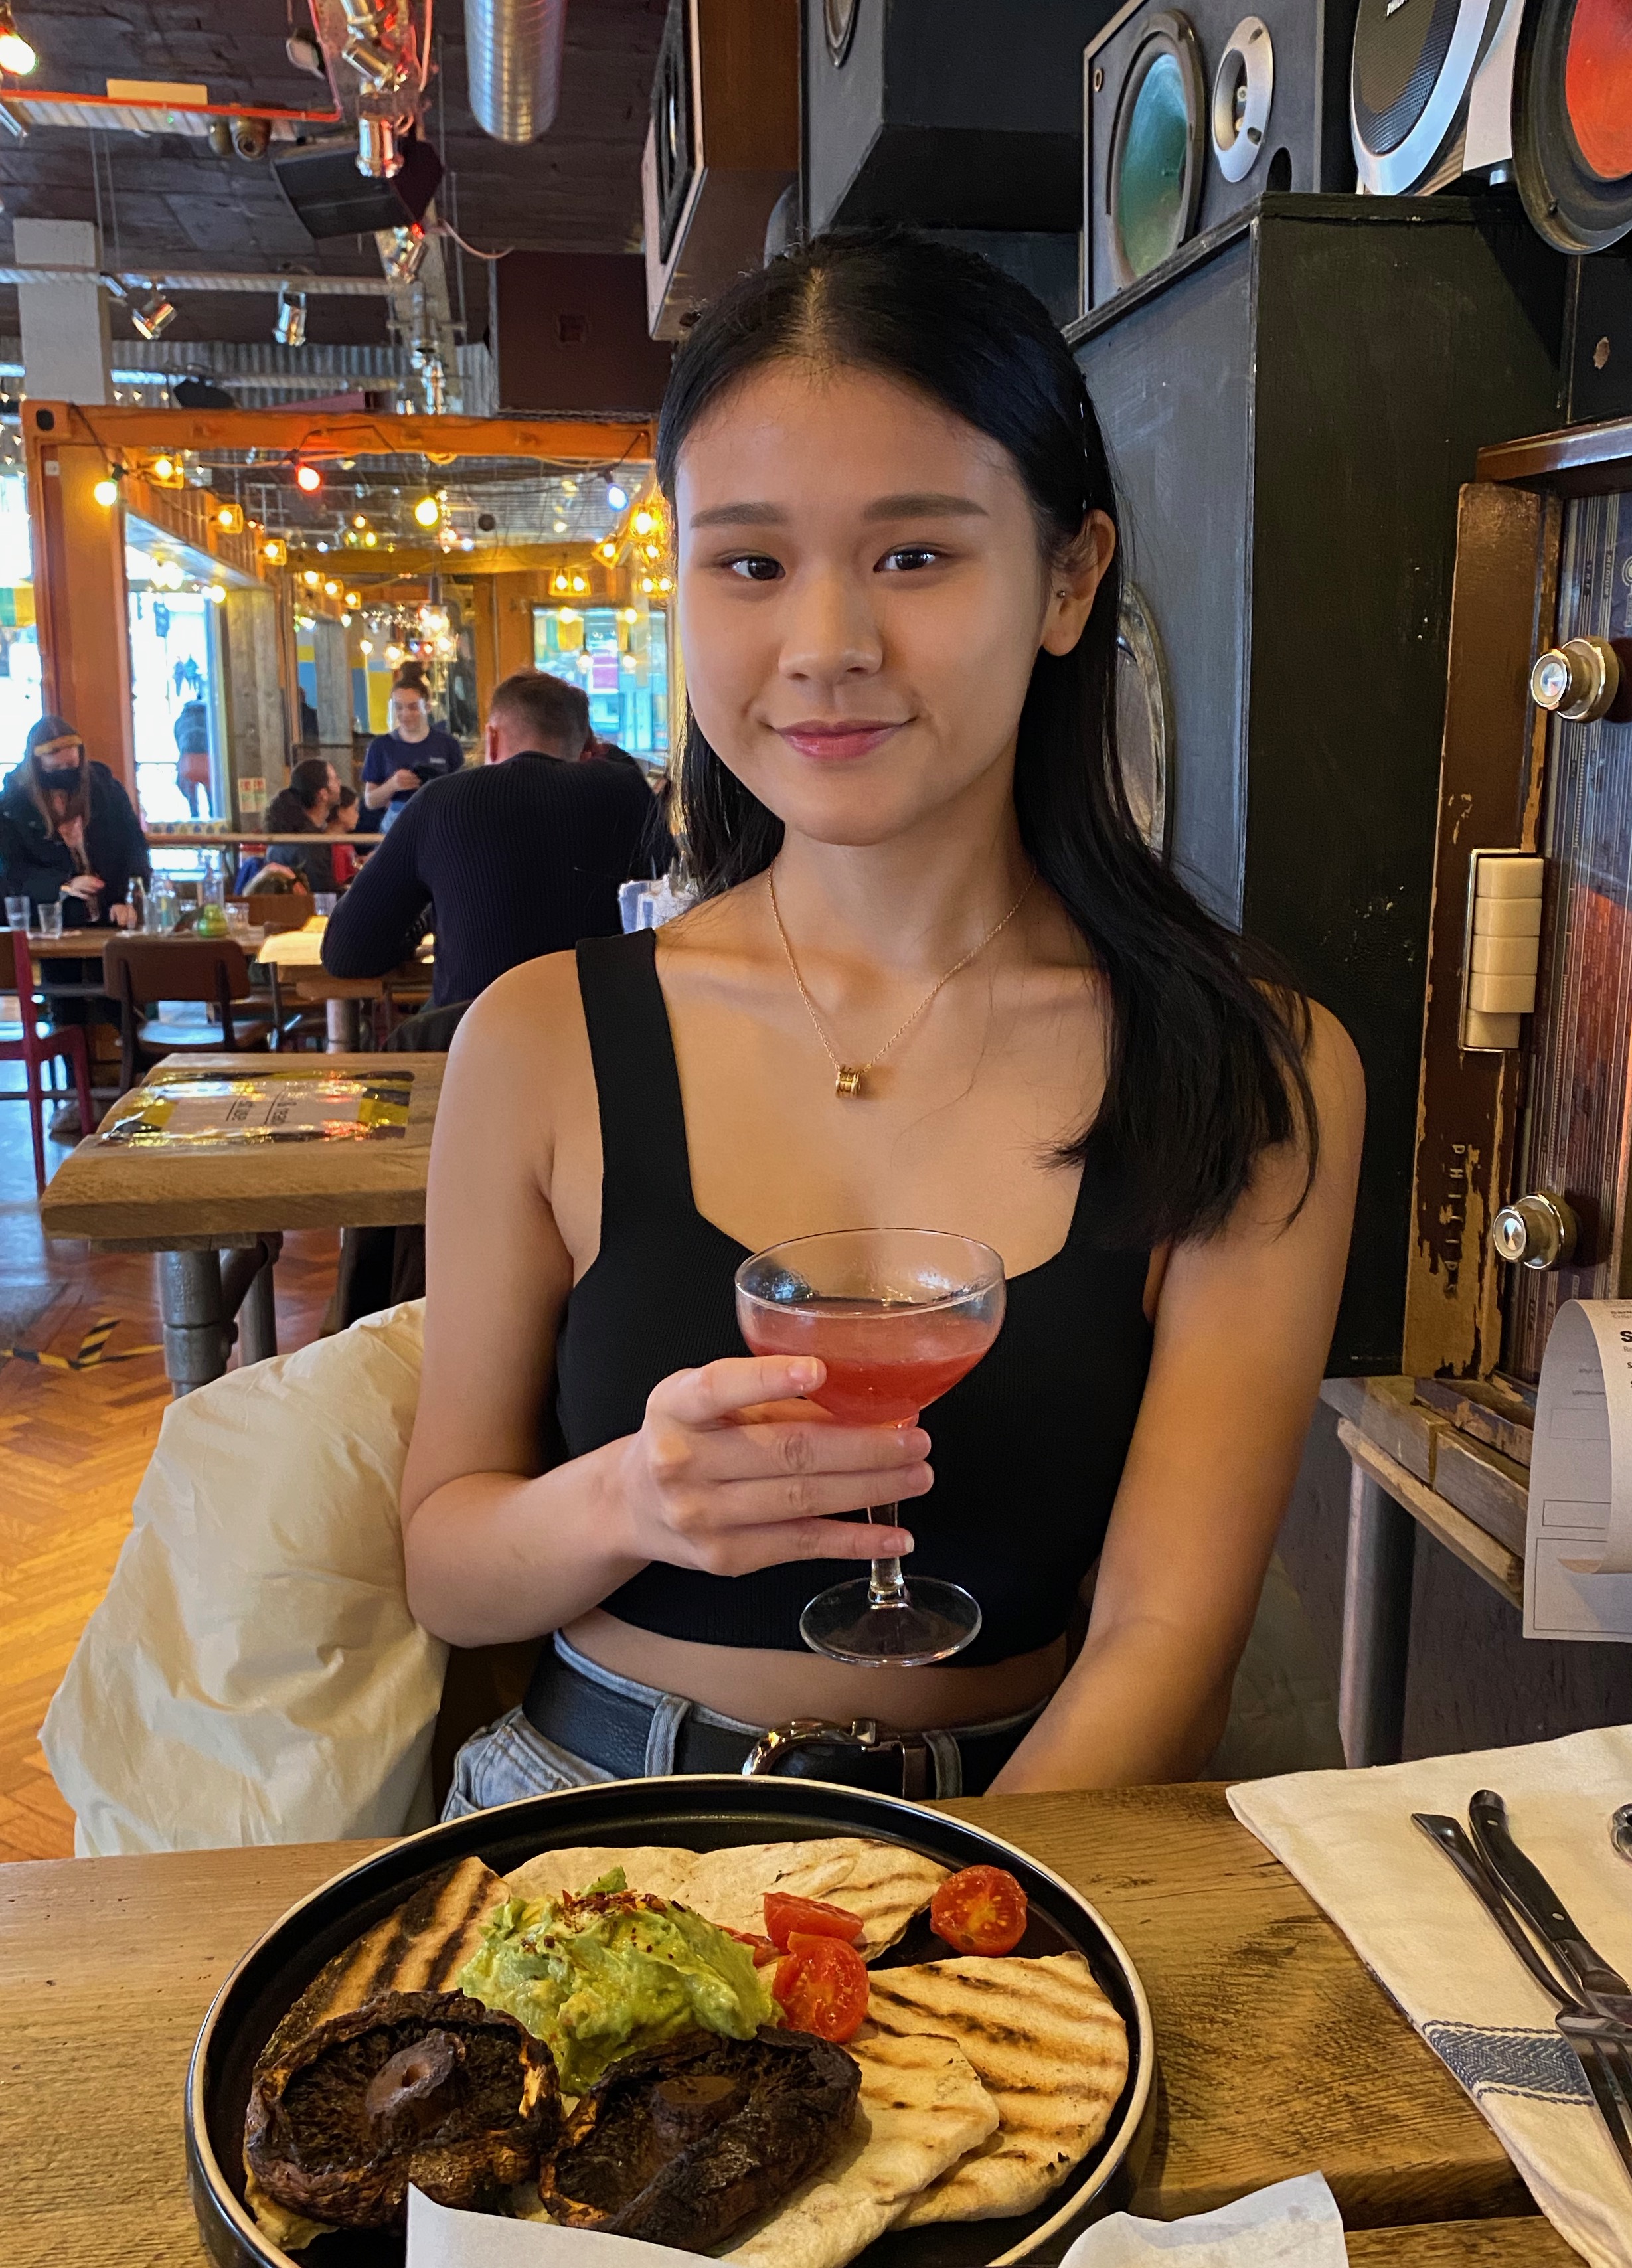
Learn about life at Surrey from a current Iranian student
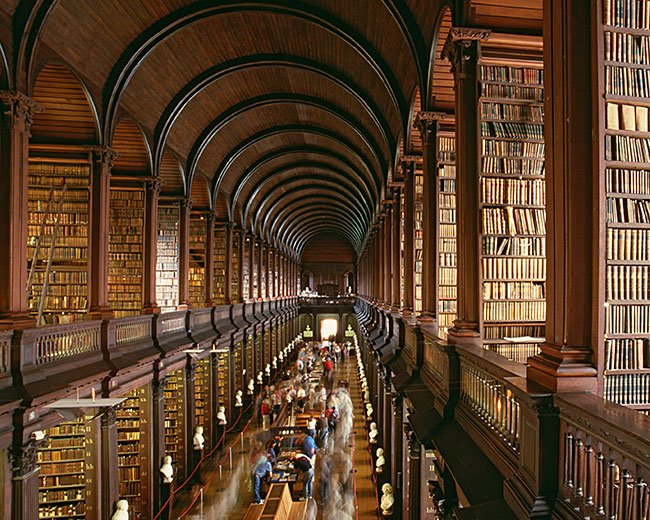
The blog for English Literature and Creative Writing at the University of Surrey
Latest Post