This is a guest post, from James Harman, from the University’s Department of Sociology:
In May 2015, the United Kingdom voted to give the Conservatives an overall majority in the House of Commons. In June 2016, the British people voted to leave the European Union in a landmark and highly controversial referendum. Just days later, Spain voted to increase the seat share of the conservative People’s Party at the expense of the much-vaunted Unidos Podemos alliance. And just last November, the United States of America elected Donald Trump as its 45th President.
All of these events returned arguably right-wing results, and all proved surprising and even deeply shocking to politicians, markets and the mass media. But why have recent Western vote outcomes been so surprisingly conservative?
For a popular vote to be a surprise, two things are needed. Voters must arrive at a certain outcome, and this outcome must conflict with what at least some people expected it to be. In the contemporary West, the most important source of electoral expectations comes from the polls produced by political research agencies. In all of the above votes, pollsters systematically underestimated the popularity of right-wing outcomes. Hence the surprise.
Much of the flack for this discrepancy has been directed against polling organisations. There are good reasons for this: polls are generally based upon quick and dirty data, frequently relying on unrepresentative convenience samples to conserve time and money. It should not be surprising that the outcomes of these polls are occasionally something less than reliable.
But there may be something else going on here. Two popular theories suggest that even where the public is correctly polled, “shy Tories” systematically downplay their willingness to vote for the Conservatives (perhaps feeling that support for this party is socially stigmatised) and “lazy Labour” supporters exaggerate their willingness to vote at all.
Prof Patrick Sturgis’ inquiry into the 2015 general election polling “miss” dismissed these theories, finding that if anything survey dishonesty has made recent election polls slightly more accurate. Furthermore, the unexpected Conservative vote boost was greatest where the Conservatives are most popular, suggesting that it cannot be explained by a “shaming” effect. Last year this was repeated in the United States, where the difference between actual and predicted Trump votes was greatest in Republican-majority districts.
These findings are interesting, but how widely applicable are they? Do they apply, for example, to last year’s EU referendum?
What do we know about “Leavers” and “Remainers”? Well, areas with larger numbers of “Leave” votes tended to be older, more economically disadvantaged, and, perhaps surprisingly, more likely to have dependent children– even disregarding age differences. Whilst economic disadvantage tends to be associated with not voting, increasing age is often linked with voter turnout and there is also some evidence that having children increases one’s likelihood of voting. It also appears that Leavers, when asked in surveys, were more disposed to put their trust in the decisions of ordinary people, as opposed to those of experts. So perhaps Leavers were more motivated to vote than Remainers.
To investigate this further, I downloaded and analysed Wave 7 of the British Election Study’s Internet Panel. This survey was conducted online in April and May 2016, shortly before the vote but early enough in advance to allow respondents to take considered stances.
At the time these data were collected, the survey respondents seemed to lean overall in the direction of voting “Remain”, with 50.4% intending to vote to Remain and 47.6% intending to vote to leave. This is similar to the findings of many convenience-sampled polls taken at the time, suggesting that the “Brexit surprise” did not stem from sampling issues.
But when we compare likelihood to vote in the EU referendum across the two camps, it becomes apparent that Leavers reported a slightly higher average likelihood to vote than Remainers. The difference is small, but then so was Leave’s margin of victory.

Figure 1. Average likelihood to vote in EU referendum by vote intention. The flipped H-shapes represent the range of values within which we can be 95% confident the “true” population values lie. As the error bars do not overlap, we can be 95% sure that Leavers reported greater average likelihood of voting than Remainers.
The effect is not limited to these two specific questions. Leavers also tended to be both more interested in the EU referendum than Remainers, and more heavily exposed to political media content. This could be taken to imply the existence of a “Lazy Remainer” syndrome.
Studies of “Shy Tory” syndrome have hitherto relied on rather indirect measures of social pressure, such as party vote shares in a local area. A more direct way of tapping into individual-level cognition is through the British Election Study’s handy social desirability scale. Because survey respondents often favour reporting convention over controversy, the designers of the BES built in four “trick questions” which detect respondent dishonesty:
- I always smile at people every time I meet them
- I always practice what I preach
- If I say to people that I will do something, I always keep my promise no matter what
- I would never lie to people
In most cases, respondents who agree with any of these statements are probably trying a bit too hard to look good.
As Figure 2 shows, Leavers tended to trigger social desirability alarm bells more often than Remainers. They thus appear to be at a greater risk of hiding their preferences when responding to polls. Even if “Shy Tory” syndrome does not exist, “Shy Leaver” syndrome seems to.

Figure 2. Number of social desirability items chosen by individual respondents intending to vote Leave and Remain in June’s referendum. Error bars to represent confidence are not possible on this kind of graph, but another procedure called a chi-squared test showed that these differences are over 95% likely to be genuine.
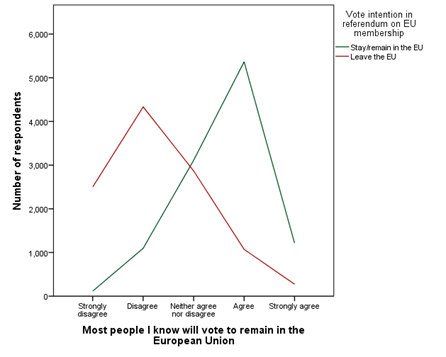
Figure 3. Expectations of respondents’ associates’ EU referendum votes by respondent EU referendum vote intention. As with Figure 4, a chi-squared test certified that these differences are highly likely to be genuine.
This last graph provides one final clue to the “surprise” of the referendum outcome: people tended to expect their acquaintances to vote in the same way as themselves. We know that people tend to associate with others like themselves, and thus could often miss out on evidence which contradicts their preconceptions. So perhaps the vote to leave the European Union was only surprising to some.
Why did the “right” side win in the EU referendum, when the polls indicated otherwise? Partly because the polls were off, but partly because ordinary, flawed, often misleading human beings were responsible for answering them. For as long as those on the right feel embarrassed about their beliefs, and those on the left fail to act upon theirs, electoral outcomes will continue to surprise us.
James Harman is a political psychologist and a postgraduate research methods student at the University of Surrey. His work has previously been published by the Electoral Reform Society, White Rose University Press and the Q-Step Network. He tweets @JamesChrHarman.
A record of the SPSS syntax and output from the analysis is available from the author on request.
This post originally appeared on the PSA Blog.
Image: Airpix CC BY-NC-ND