And so we close in to the end of Article 50.
Or maybe not. This month’s most significant development – in a not that hotly contested field – might be Theresa May’s concession that an extension might be possible/needed.
If this comes to pass, then we might expect more substantial activity taking place, if only because the EU has indicated that an extension has to be for a purpose, so Number 10 will have to come up with something on this.
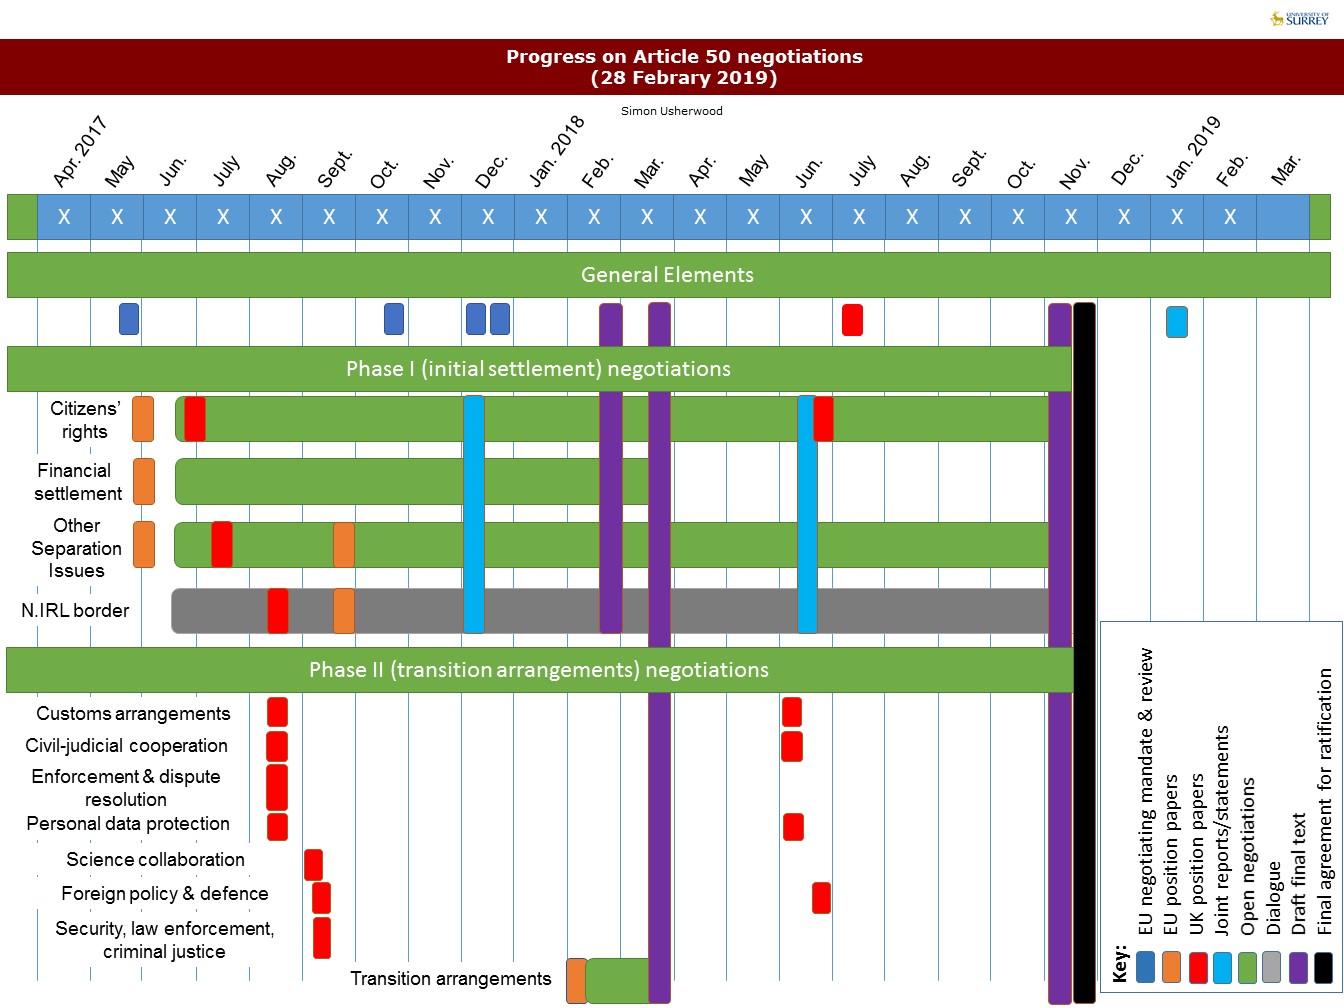
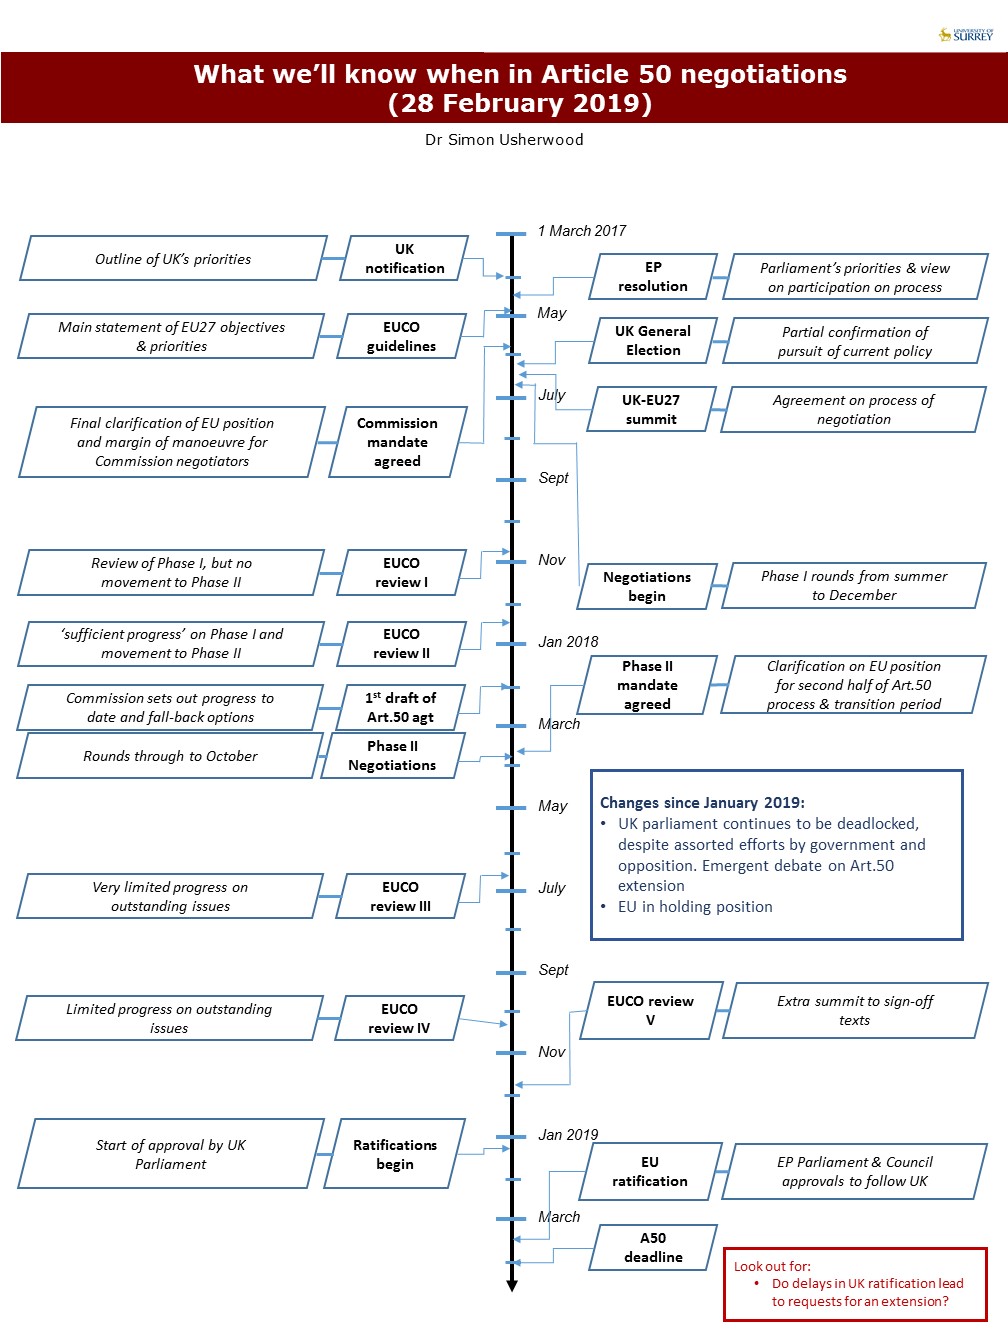
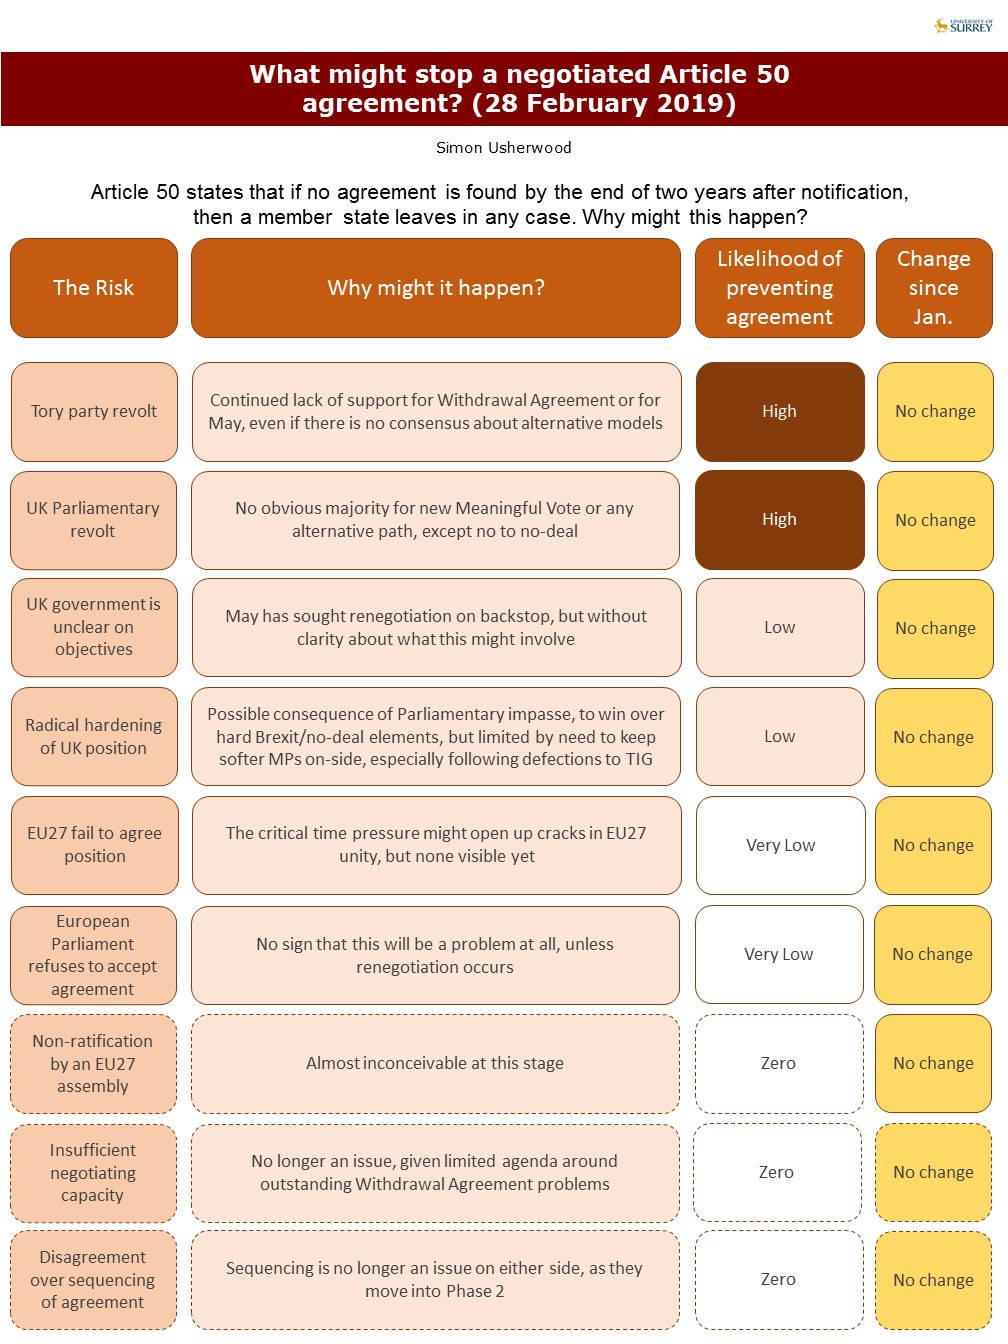
With The Independent Group still too small to make a big impact on voting patterns, and with Labour’s call for another referendum still rather ambiguous, February has been another month of much noise and little action, as reflected in the infographics below.
While I’ve not raised the chances of a no-deal from last month, it’s important to factor in the severe shortage of time left to make decisions, which raises semi-automatically the probability of an accidental no-deal. If you want a figure, I think we’re about 40% for no-deal, up from the 30% it’s been at for the period since the November signing off of the Withdrawal Agreement.
This time next month, maybe we’ll know more, even if it’s only how I’m going to fit more months onto these graphics…
PDF versions: A50 barriers Feb 19; A50 progress Feb 19; A50 timeline Feb 19