So, here we are, a day shy of the original two-year period of Article 50 and hardly much sense of how this all ends.
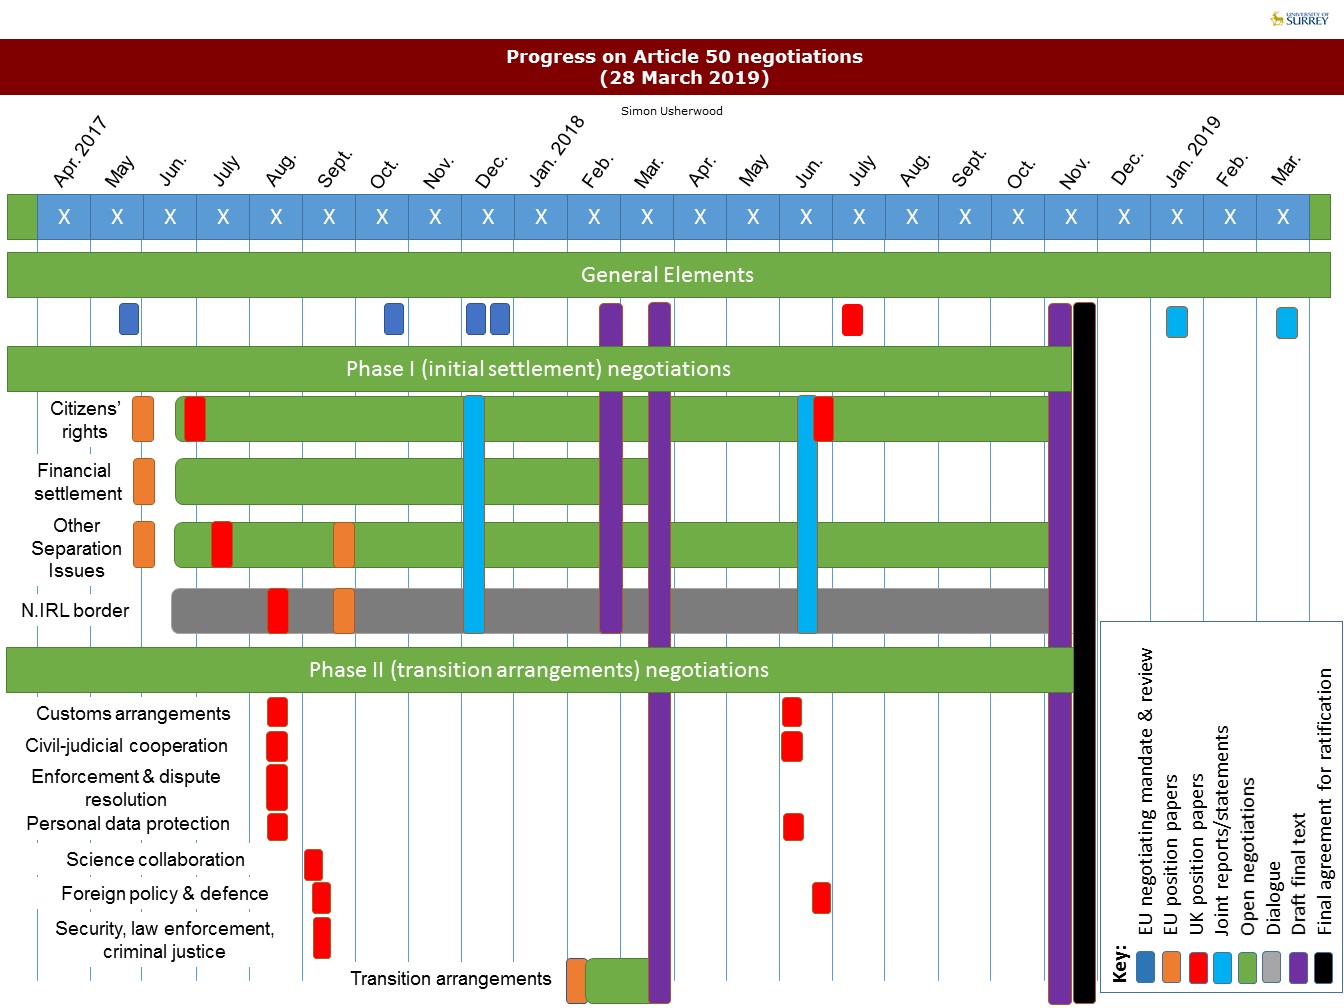
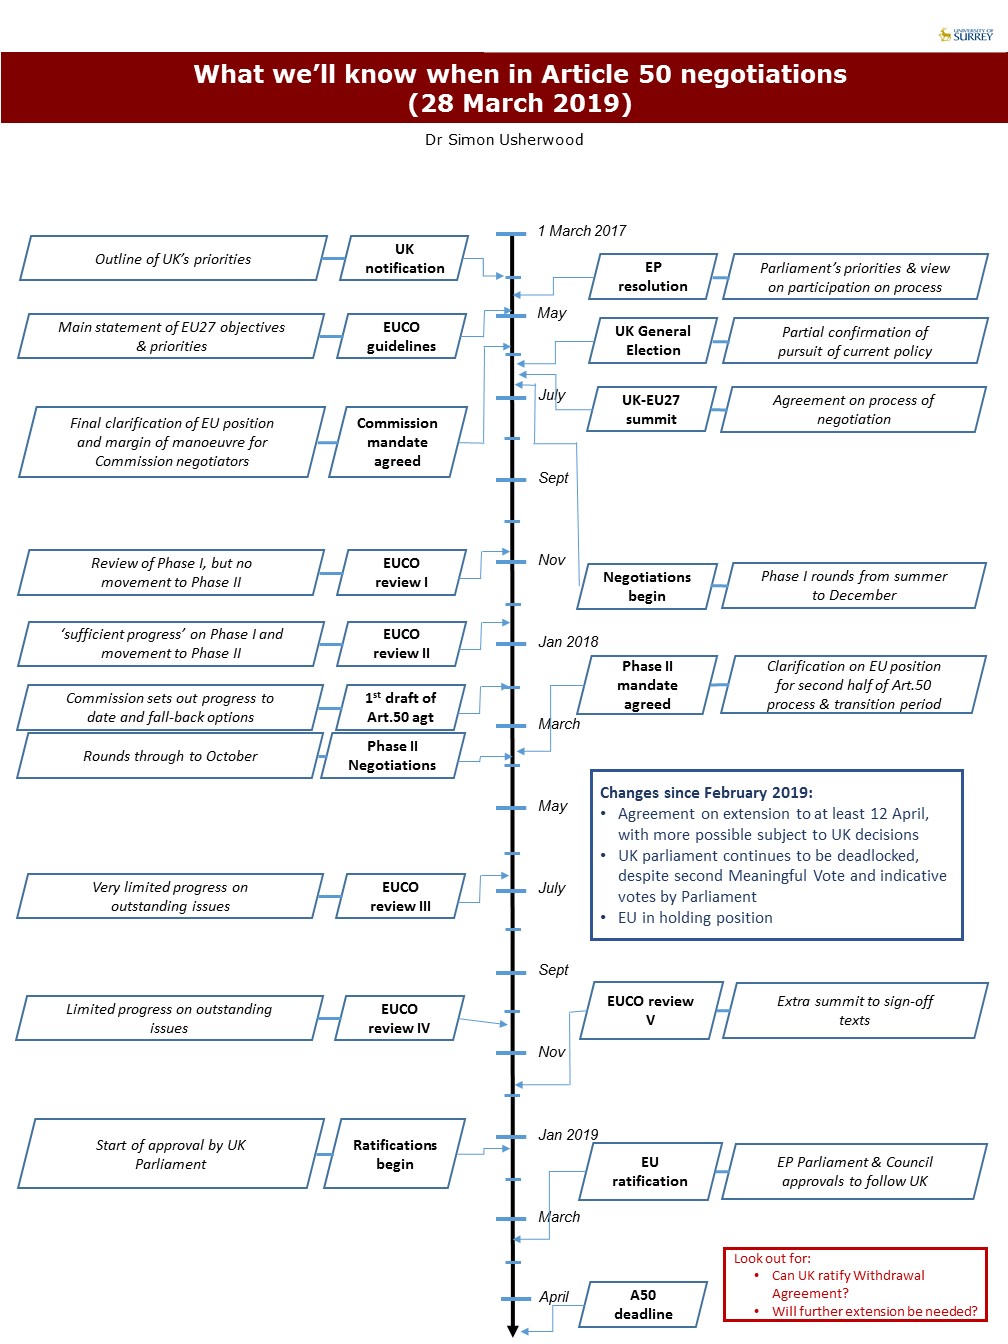
I’ve updated the graphics as normal, although I see that next month will be a real pain in the neck with squeezing in more months (#FirstWorldProblems).
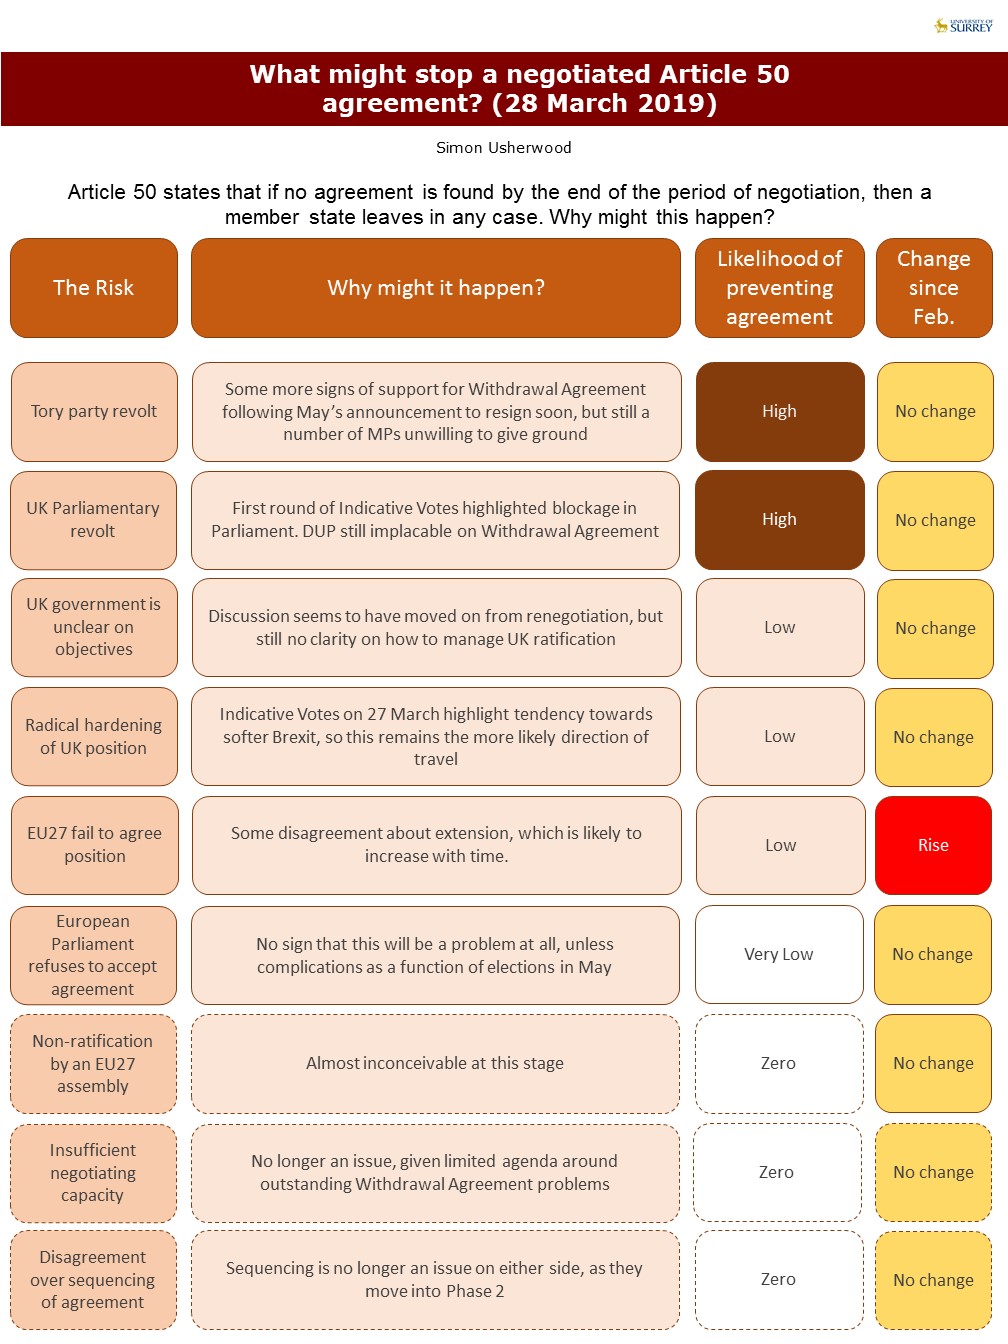
For all that’s happened, not much has changed. Extension looks to be the more consequential part of it all, since it is being cast in terms of the UK making choices, which doesn’t look too promising.
On the barriers to agreement, I’ve not change much in the way of ratings, as I’d factored in the UK a while back. However, the EU is going to become ever more important, especially when we come back to extension number 2, which is now surely on the cards.
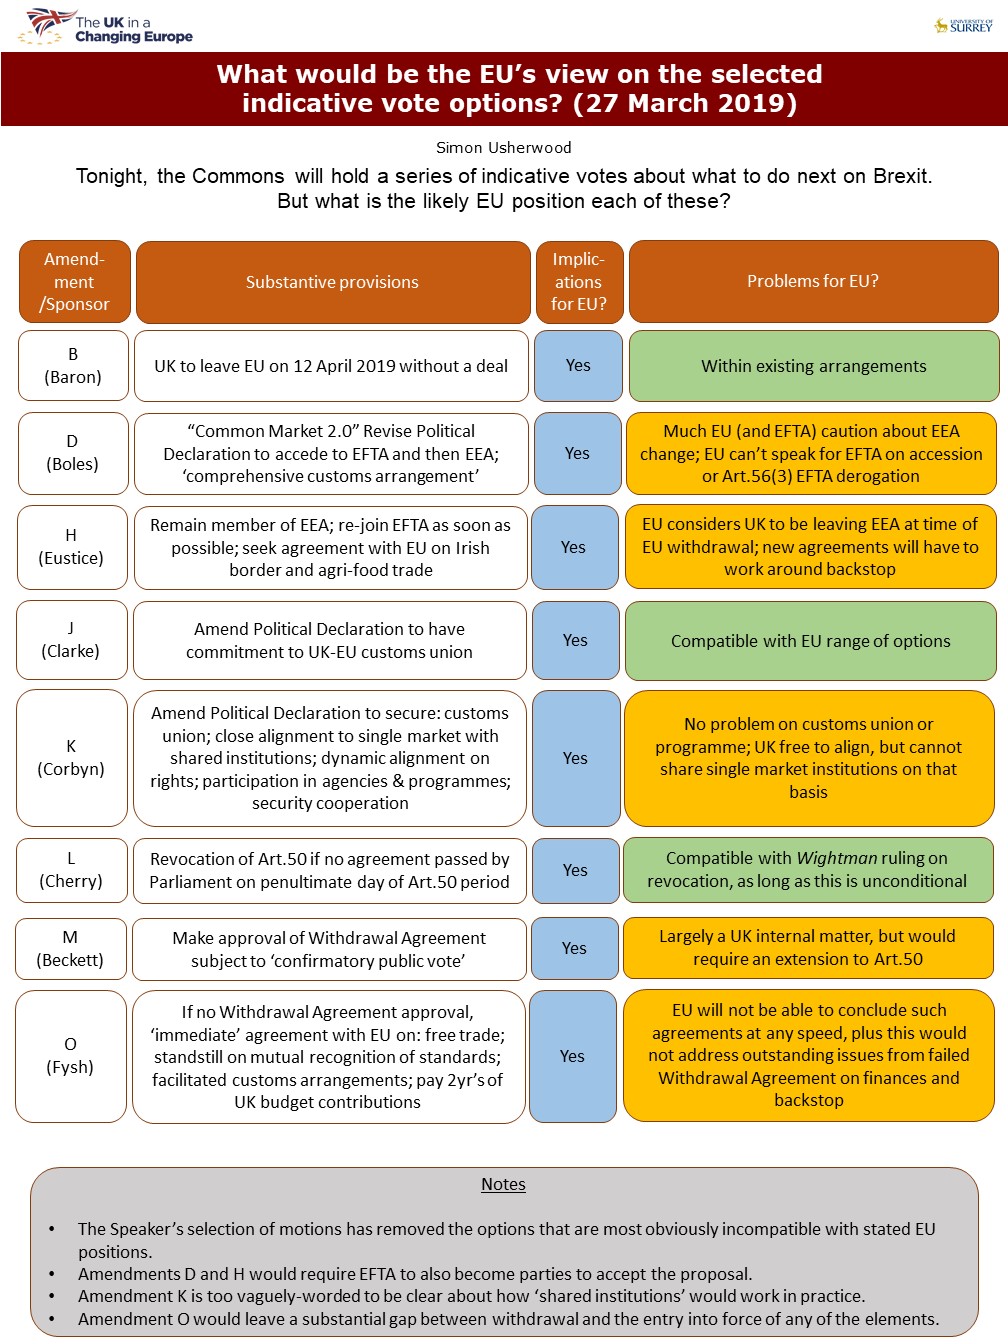
Finally, as a bonus, I add in the figure I did yesterday on the EU’s view of the various options in the Indicative Votes, which seemed to be rather popular.
PDF versions at the bottom, as ever, with clickable links.
PDF versions: A50 barriers Mar 19; A50 progress Mar 19; A50 timeline Mar 19


Given that the EU27 are planning on how to respond to a No Deal Brexit and any British desires to come back to the negotiating table, I’m afraid it is becoming much clearer how it this will all end:
1. May by some miracle gets the Withderawal Agreement and and Political Declaration passed.
2. (a) No Deal Brexit on April 12th, followed by the UK coming back to negotiate a new trade deal and to negotiate on measures to mitigate the effects of the No Deal Brexit. The EU27 present the 3 pre-conditions (paying off the monies due, guaranteeing EU27 citizens rights and no hard border in Ireland) and the UK accepts. Thus we end up in the same place as 1 but with a lot of pain.
2. (b) The same as 2 (a) except the UK doesn’t accept the preconditions and remains isolated from the EU and goes through some amount of further economic damage.