Hi everyone,
With the latest heatwave coming into the UK, it feels as if Summer is already upon us. For any Singaporean, that means… SLIPPERS!!! Most of the buildings here are built to keep the warmth in, so if you’re indoors, it might get a little too warm which is why I’m really glad I got myself a pedestal fan early in the year. Now, aside from it providing ventilation, I’ve got a bit of cool air coming my way!
As the title suggests, Semester 2 is almost at its end, with most lessons ending last week. There’s just the small matter of exams that begin from tomorrow (26th May) to 16th June. I’ve just got 2 this time around because I’ve had lots of papers to write over the semester that has made up most of my assessments. It’s interesting to watch other students as a postgraduate student now because I probably was like most of them back in my undergraduate days, looking all stressed out and nervous. Perhaps it does come with age, that you learn to manage all these things better. I just take things as they come and get them out of the way one by one.
So the talk of “长痛不如短痛”, a preference for short-term pain (exams/tests) over a long-term pain (writing reports or in my case, research papers) no longer holds water for me because I’m now at a point where both are regarded similarly. For me, I’ll just get down to the task, complete it to the best of my ability and pray hard throughout that my script/research paper finds favour in the eyes of the examiners. The principle of never leaving it all to the last minute still applies though. Just don’t!
Anyway, my 2 big assignments for the semester are all complete and submitted: Machine Learning and Supply Chain Analytics. Today, I’ll share a little bit about them both, so that you’ll have a rough idea of what we actually do in our MSc Business Analytics course.
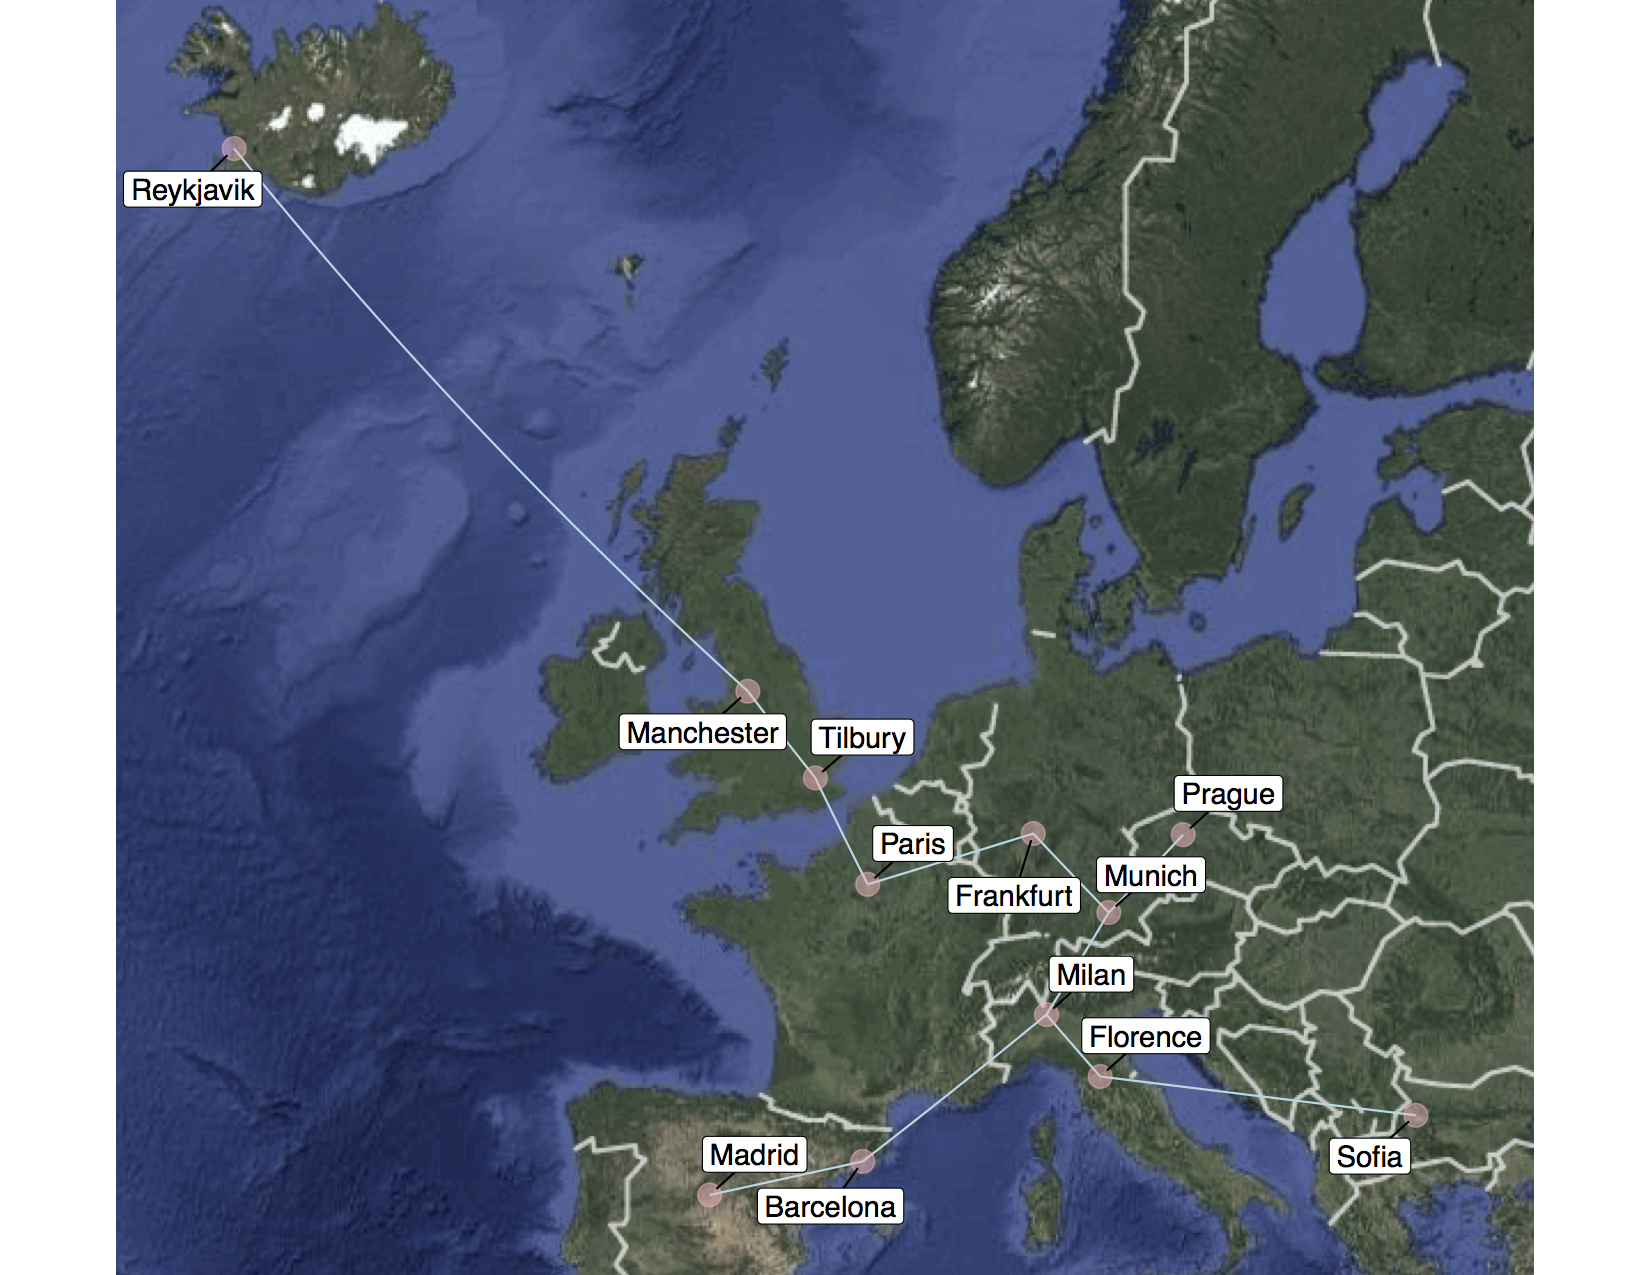
First up, Supply Chain Analytics. Manufacturing companies all rely on a well-designed supply-chain to ensure that their goods are manufactured, shipped to the distribution centres and eventually delivered to their customers all within the agreed time frame. Our job in Supply Chain Analytics is to ensure that is done in the most cost-efficient way possible. In our extremely tedious research assignment, we had to find 5 rice suppliers from around the India-Himalayan region that will send their rice to the Indian ports of Kandla, Mumbai and Paradip to Tilbury Port in UK. We were required to find the amount that we needed to ship in containers, how big we want our containers to be and how much profit we’d make out of it. Then we’d have to find out how we should set up our Distribution Network within Europe using Kruskal’s algorithm and building a Minimal Spanning Tree. Finally, we had to determine how to setup our warehouses at Tilbury port to ensure that all of these can be achieved. This was done using simulation, minus the very cool VR stuff from our lab session.
It’s one of the most complicated assignments I’ve ever done because the questions were “undefined”. In school, this would frustrate everyone to bits because we’re all used to having properly defined questions that required defined answers. In the real world, it would be just as what we had for this research assignment. Even though this was an individual assignment, most of us decided to help each other out because that was the only way we could move forward. That’s one of the benefits of us being a very small Masters group.
Here are some of the things from our Supply Chain Analytics work:
Our Distribution Network that was used to build a Minimal Spanning Tree using Kruskal’s Algorithm.
And our Tilbury warehouse simulation web done on Arena, which obviously doesn’t look as cool as the one that is done on Simio with an Oculus for VR: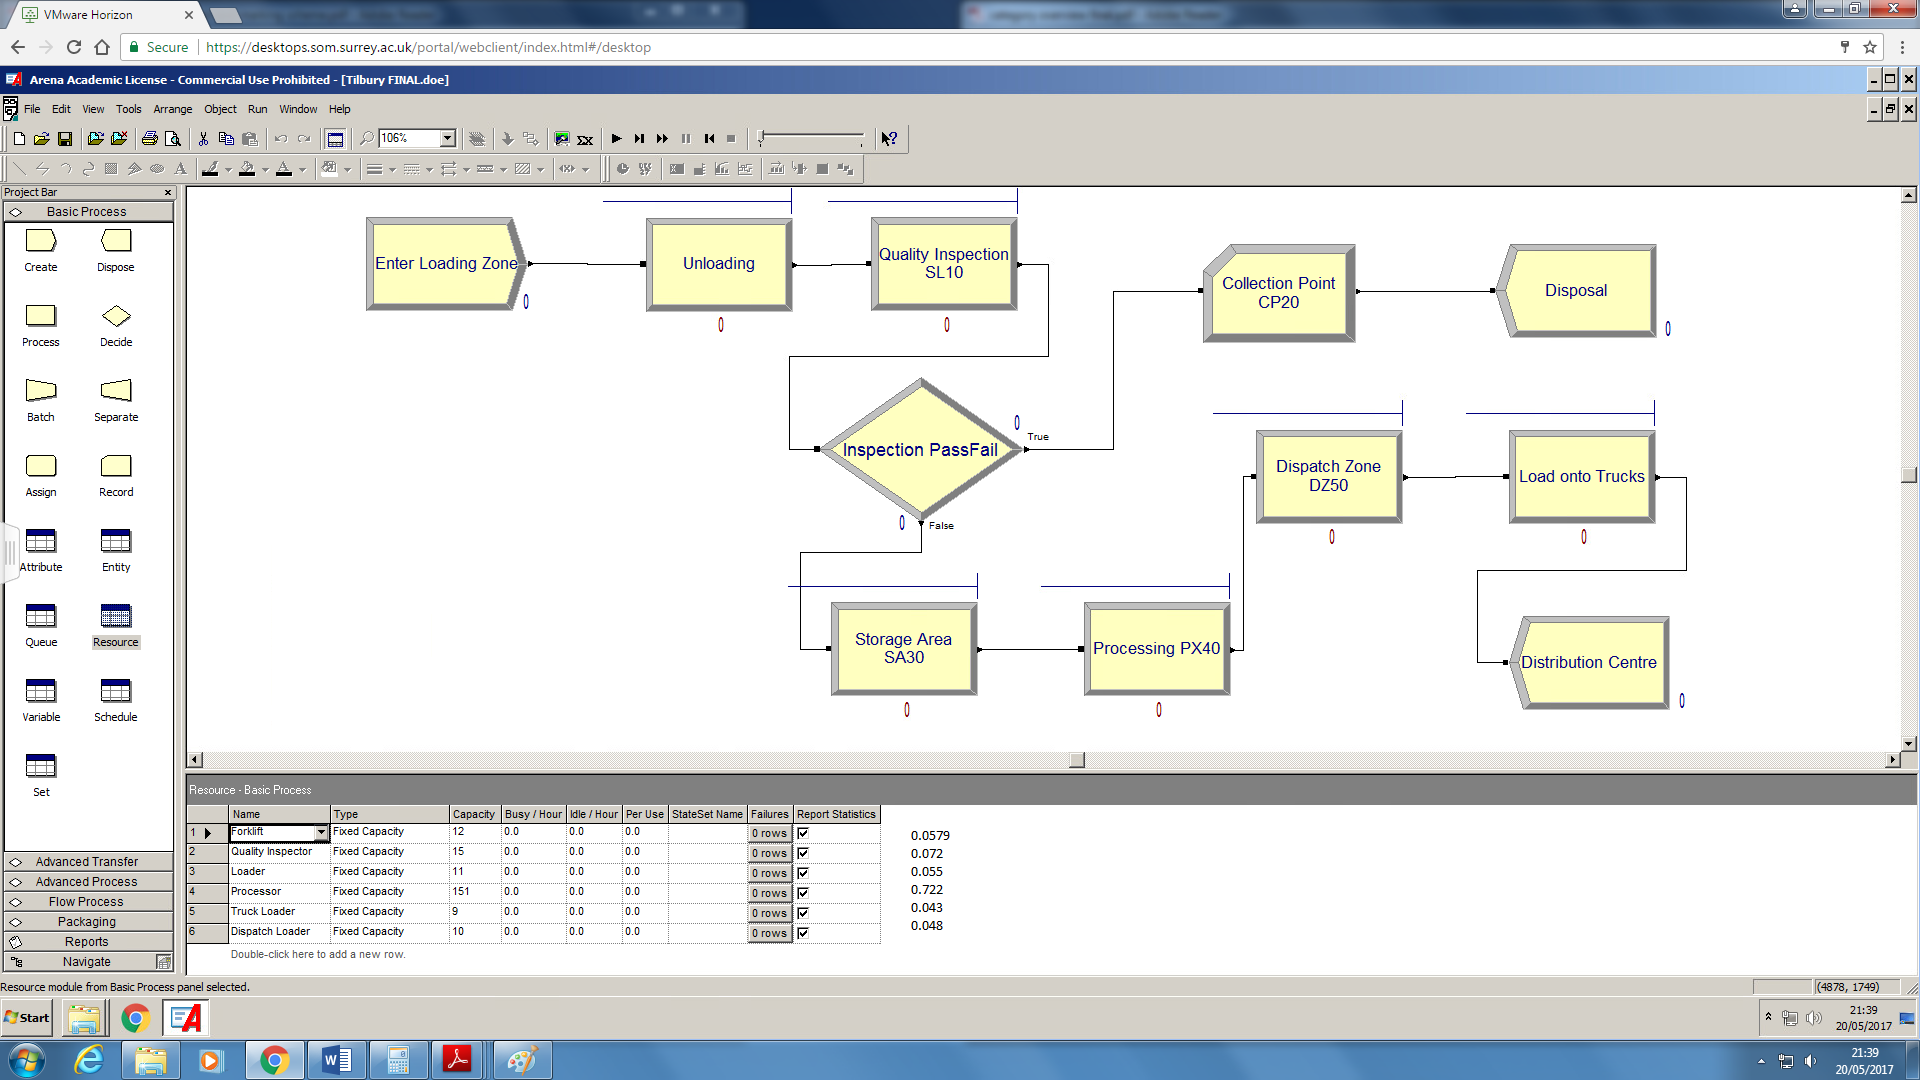
There were obviously quite a handful of other Excel sheets that were just plenty of numbers and tables so it wouldn’t have been any interesting to look at anyway.
Our 2nd big assignment was the Machine Learning R Code I’ve been talking about for some weeks now. It revolves around the customer Churn problem that telecommunications companies face (a.k.a. customer attrition). In simpler terms, telco subscribers like you and I often leave for another telco for various reasons. As machine learning specialists, we had to develop a model that could predict who among the customers would churn so that telcos can focus on enticing them with good offers/promotions to prevent them from leaving.
For someone with ZERO programming background, this was an incredibly challenging assignment because I had to learn to do R Coding in 3 weeks. For the first time ever, I got to experience what it was like to be coding and can finally understand the frustrations of coders. This assignment worried me a lot and I am very thankful for all the help I got along the way that eventually got me going. By the end of it, I was able to produce something workable and could even help out several of my friends who were still behind. It was a hugely satisfying experience to work on R (which also required a report to the Management to provide them with actionable insights based on the analysis we’ve done) and I got plenty of joy from helping my friends out as well.
Here are some of the R outputs that I got on my R Script:
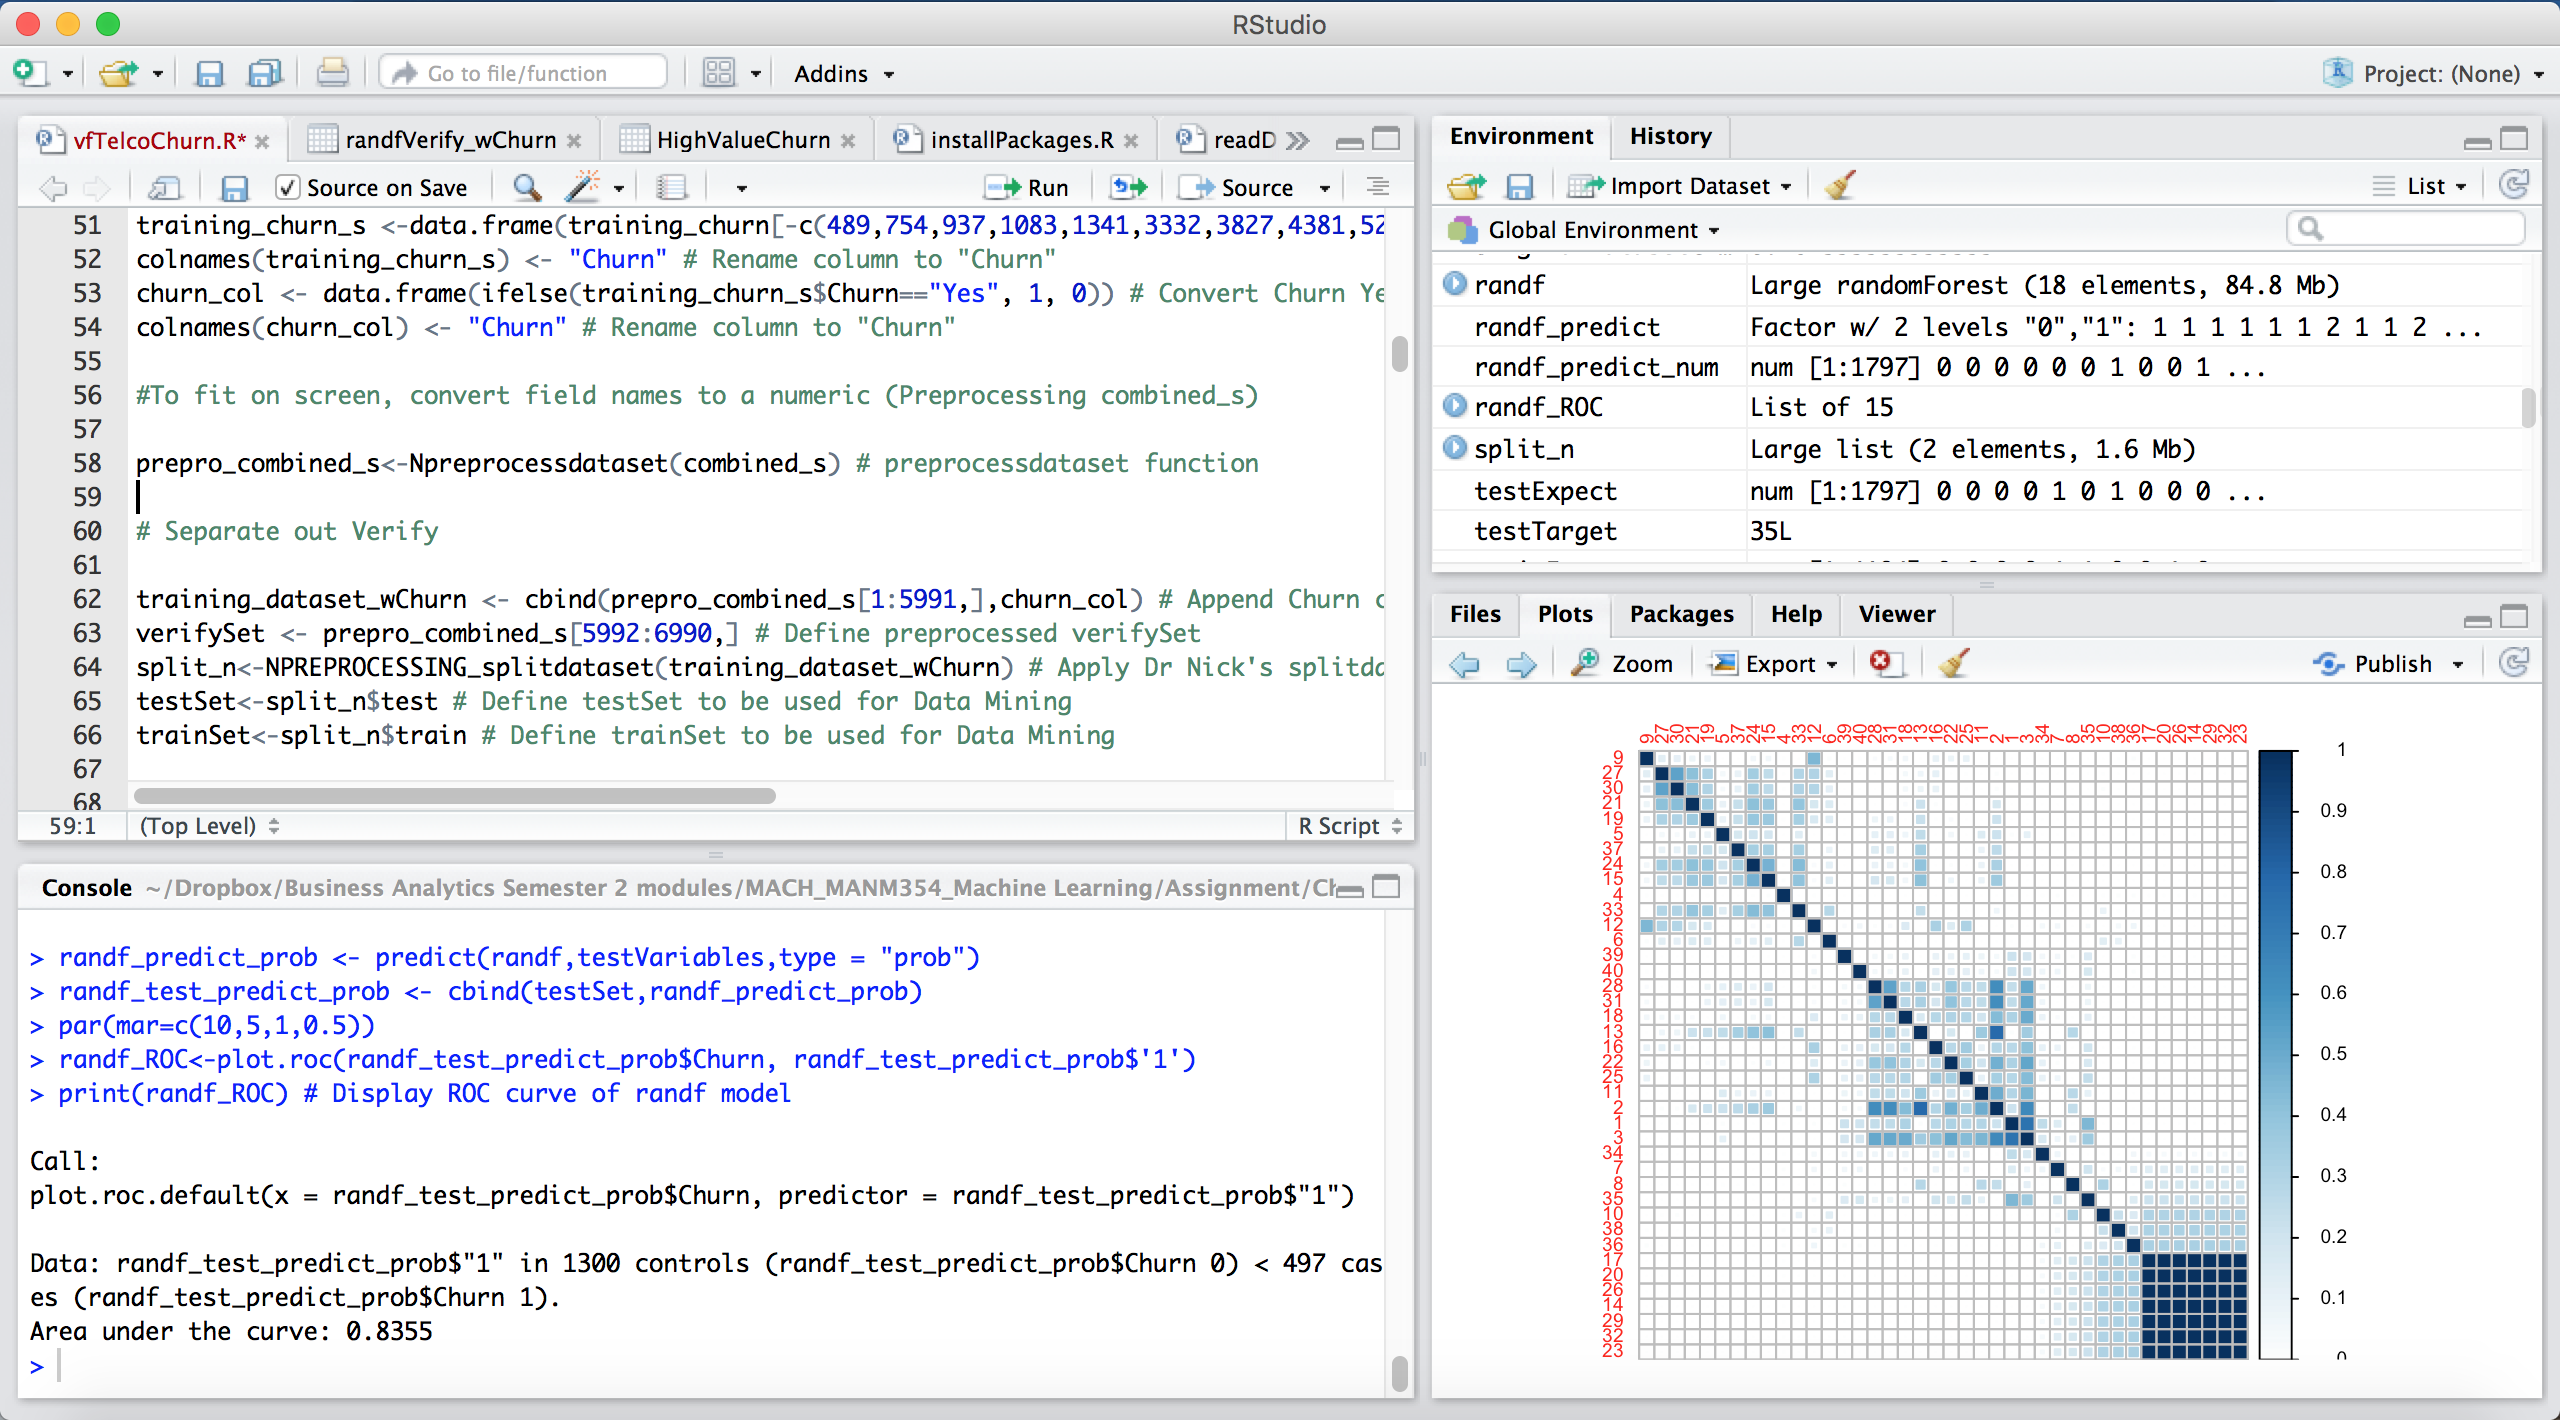
This here is a correlogram that allowed us to visualise correlation of customer characteristics in a matrix form:
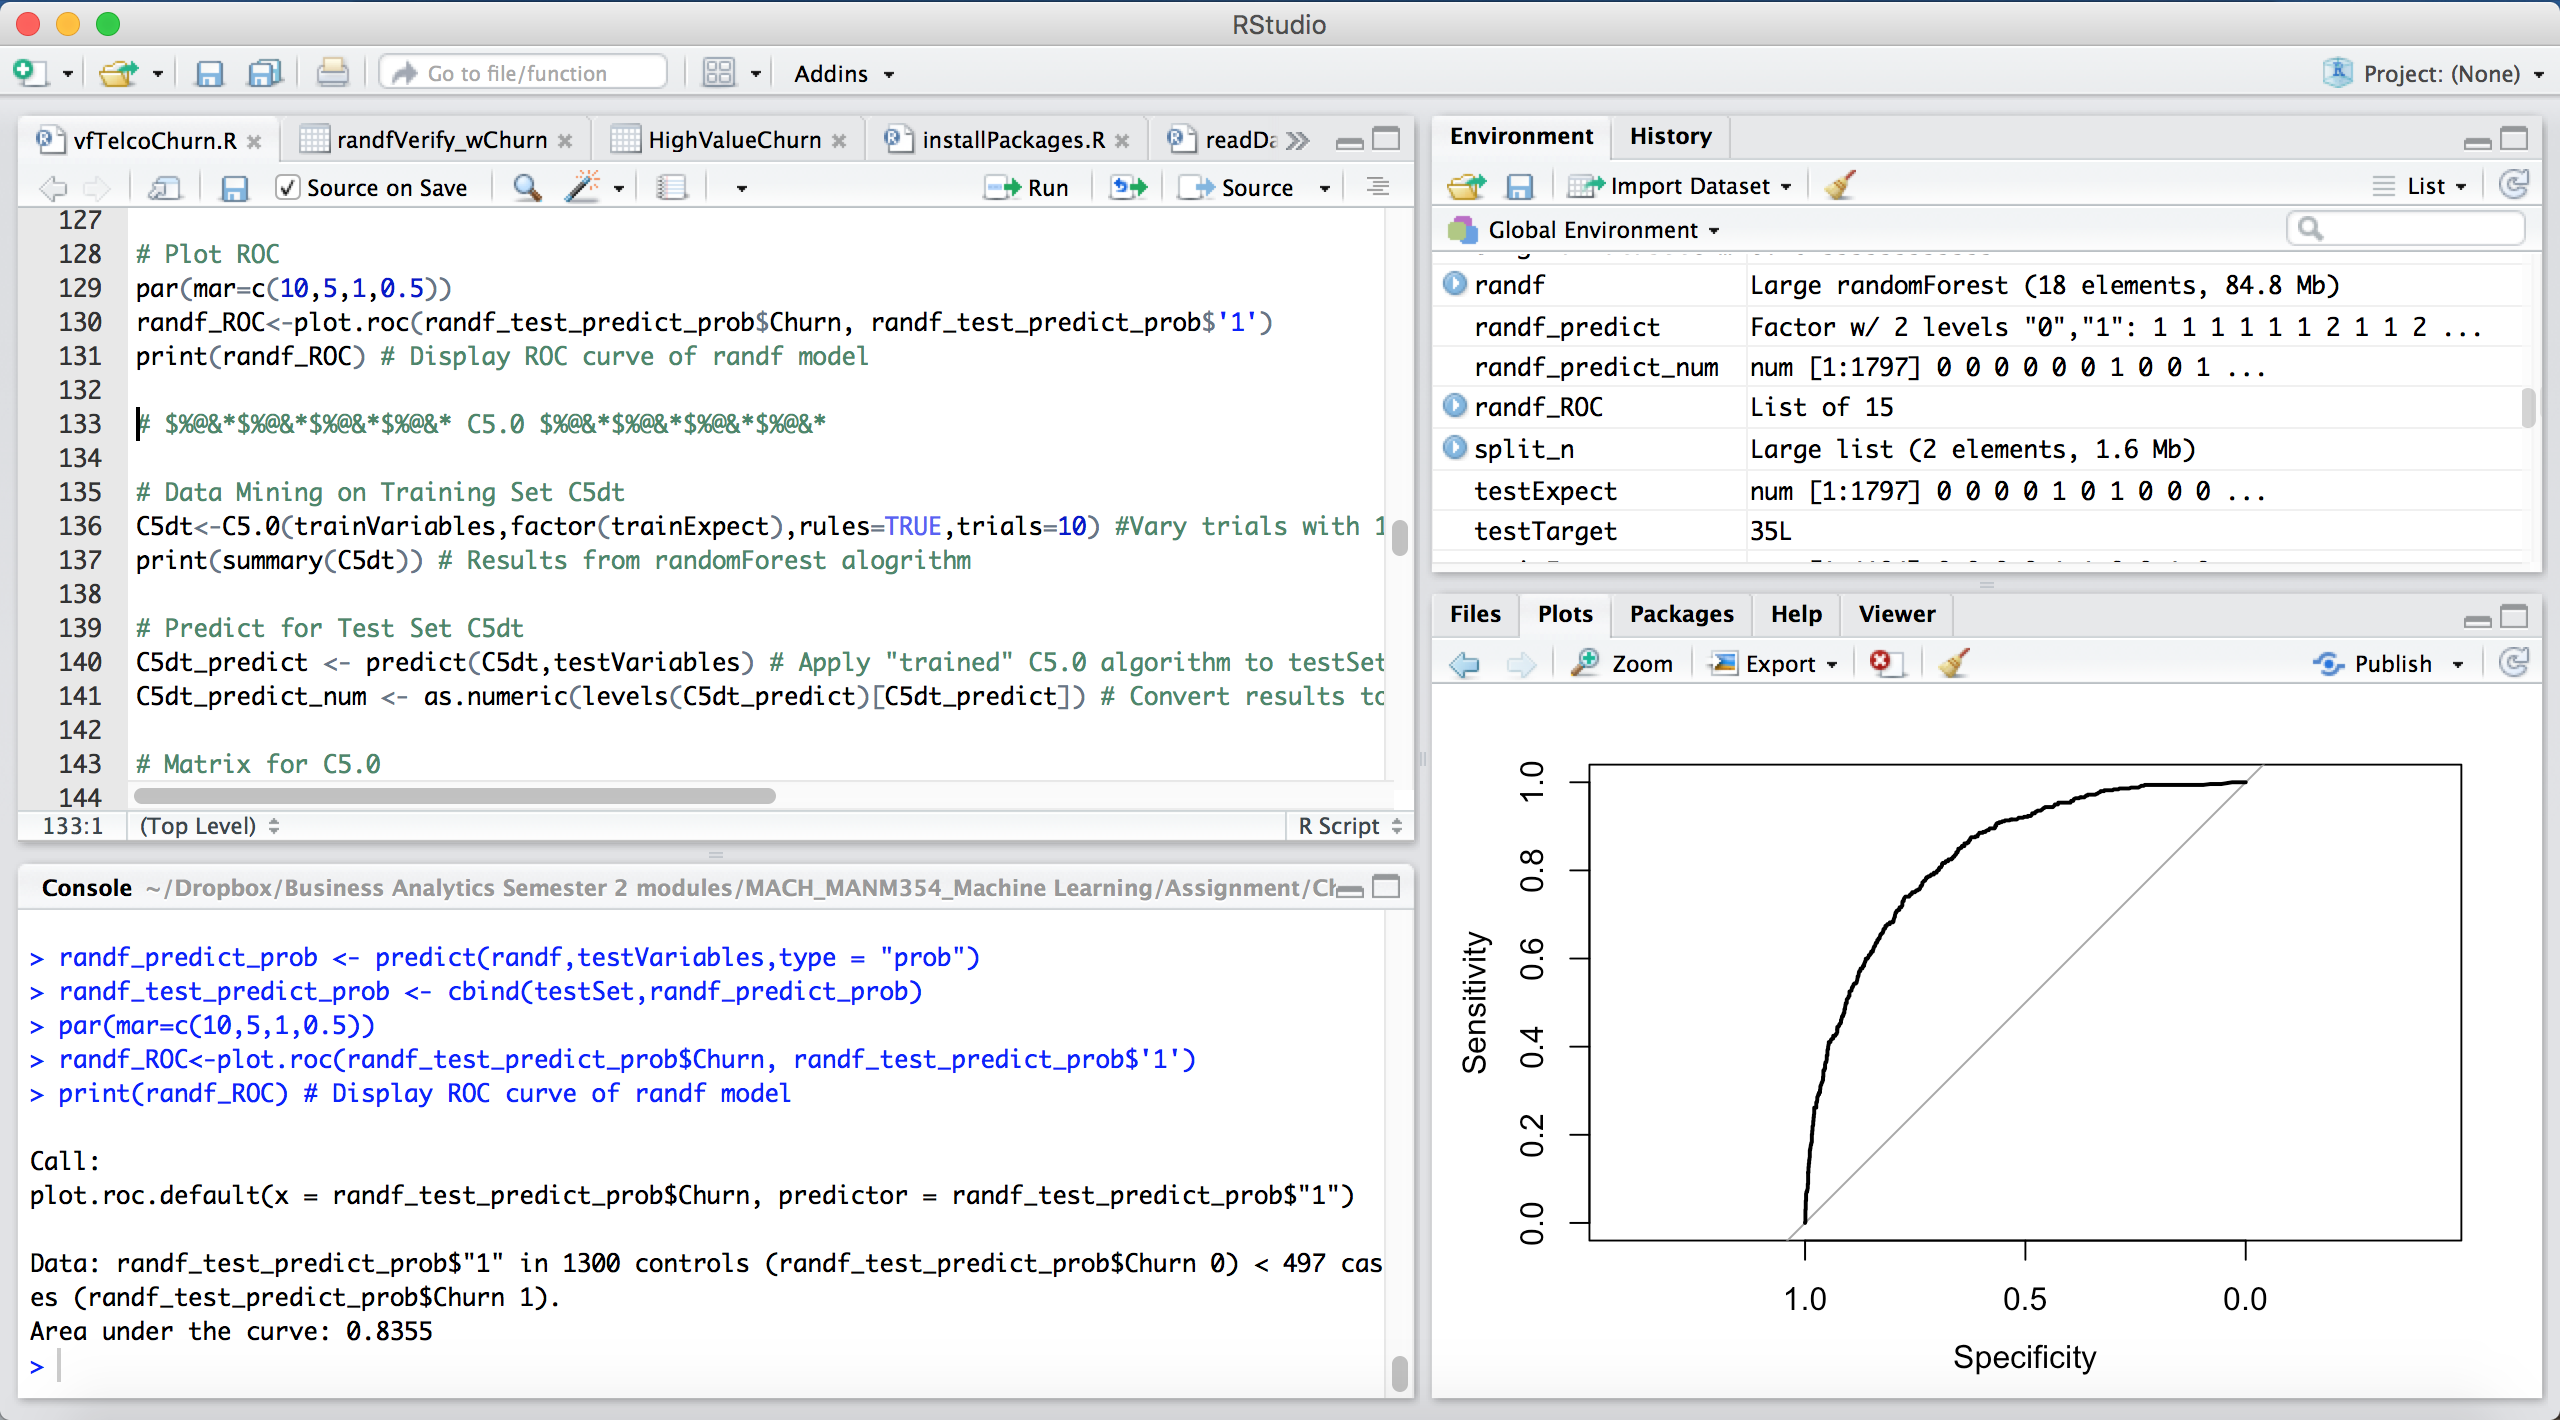
While, this is a Receiver Operating Characteristics (ROC) curve that measures the quality of the model. The closer it is to being a right-angled triangle, the better it’ll be. If you notice, there’s a “Area under the curve” at the bottom left corner. When that is 1.0, you get a 100% accurate model, which is not possible in reality. The closer you are to 1.0, the better. In other words, if you’re close to 1.0, the ROC curve would be very close to a right-angled triangle.
I eventually got down to profiling customers who churned and found out that they generally share some common characteristics, which I used a barplot to illustrate to the management in my report:
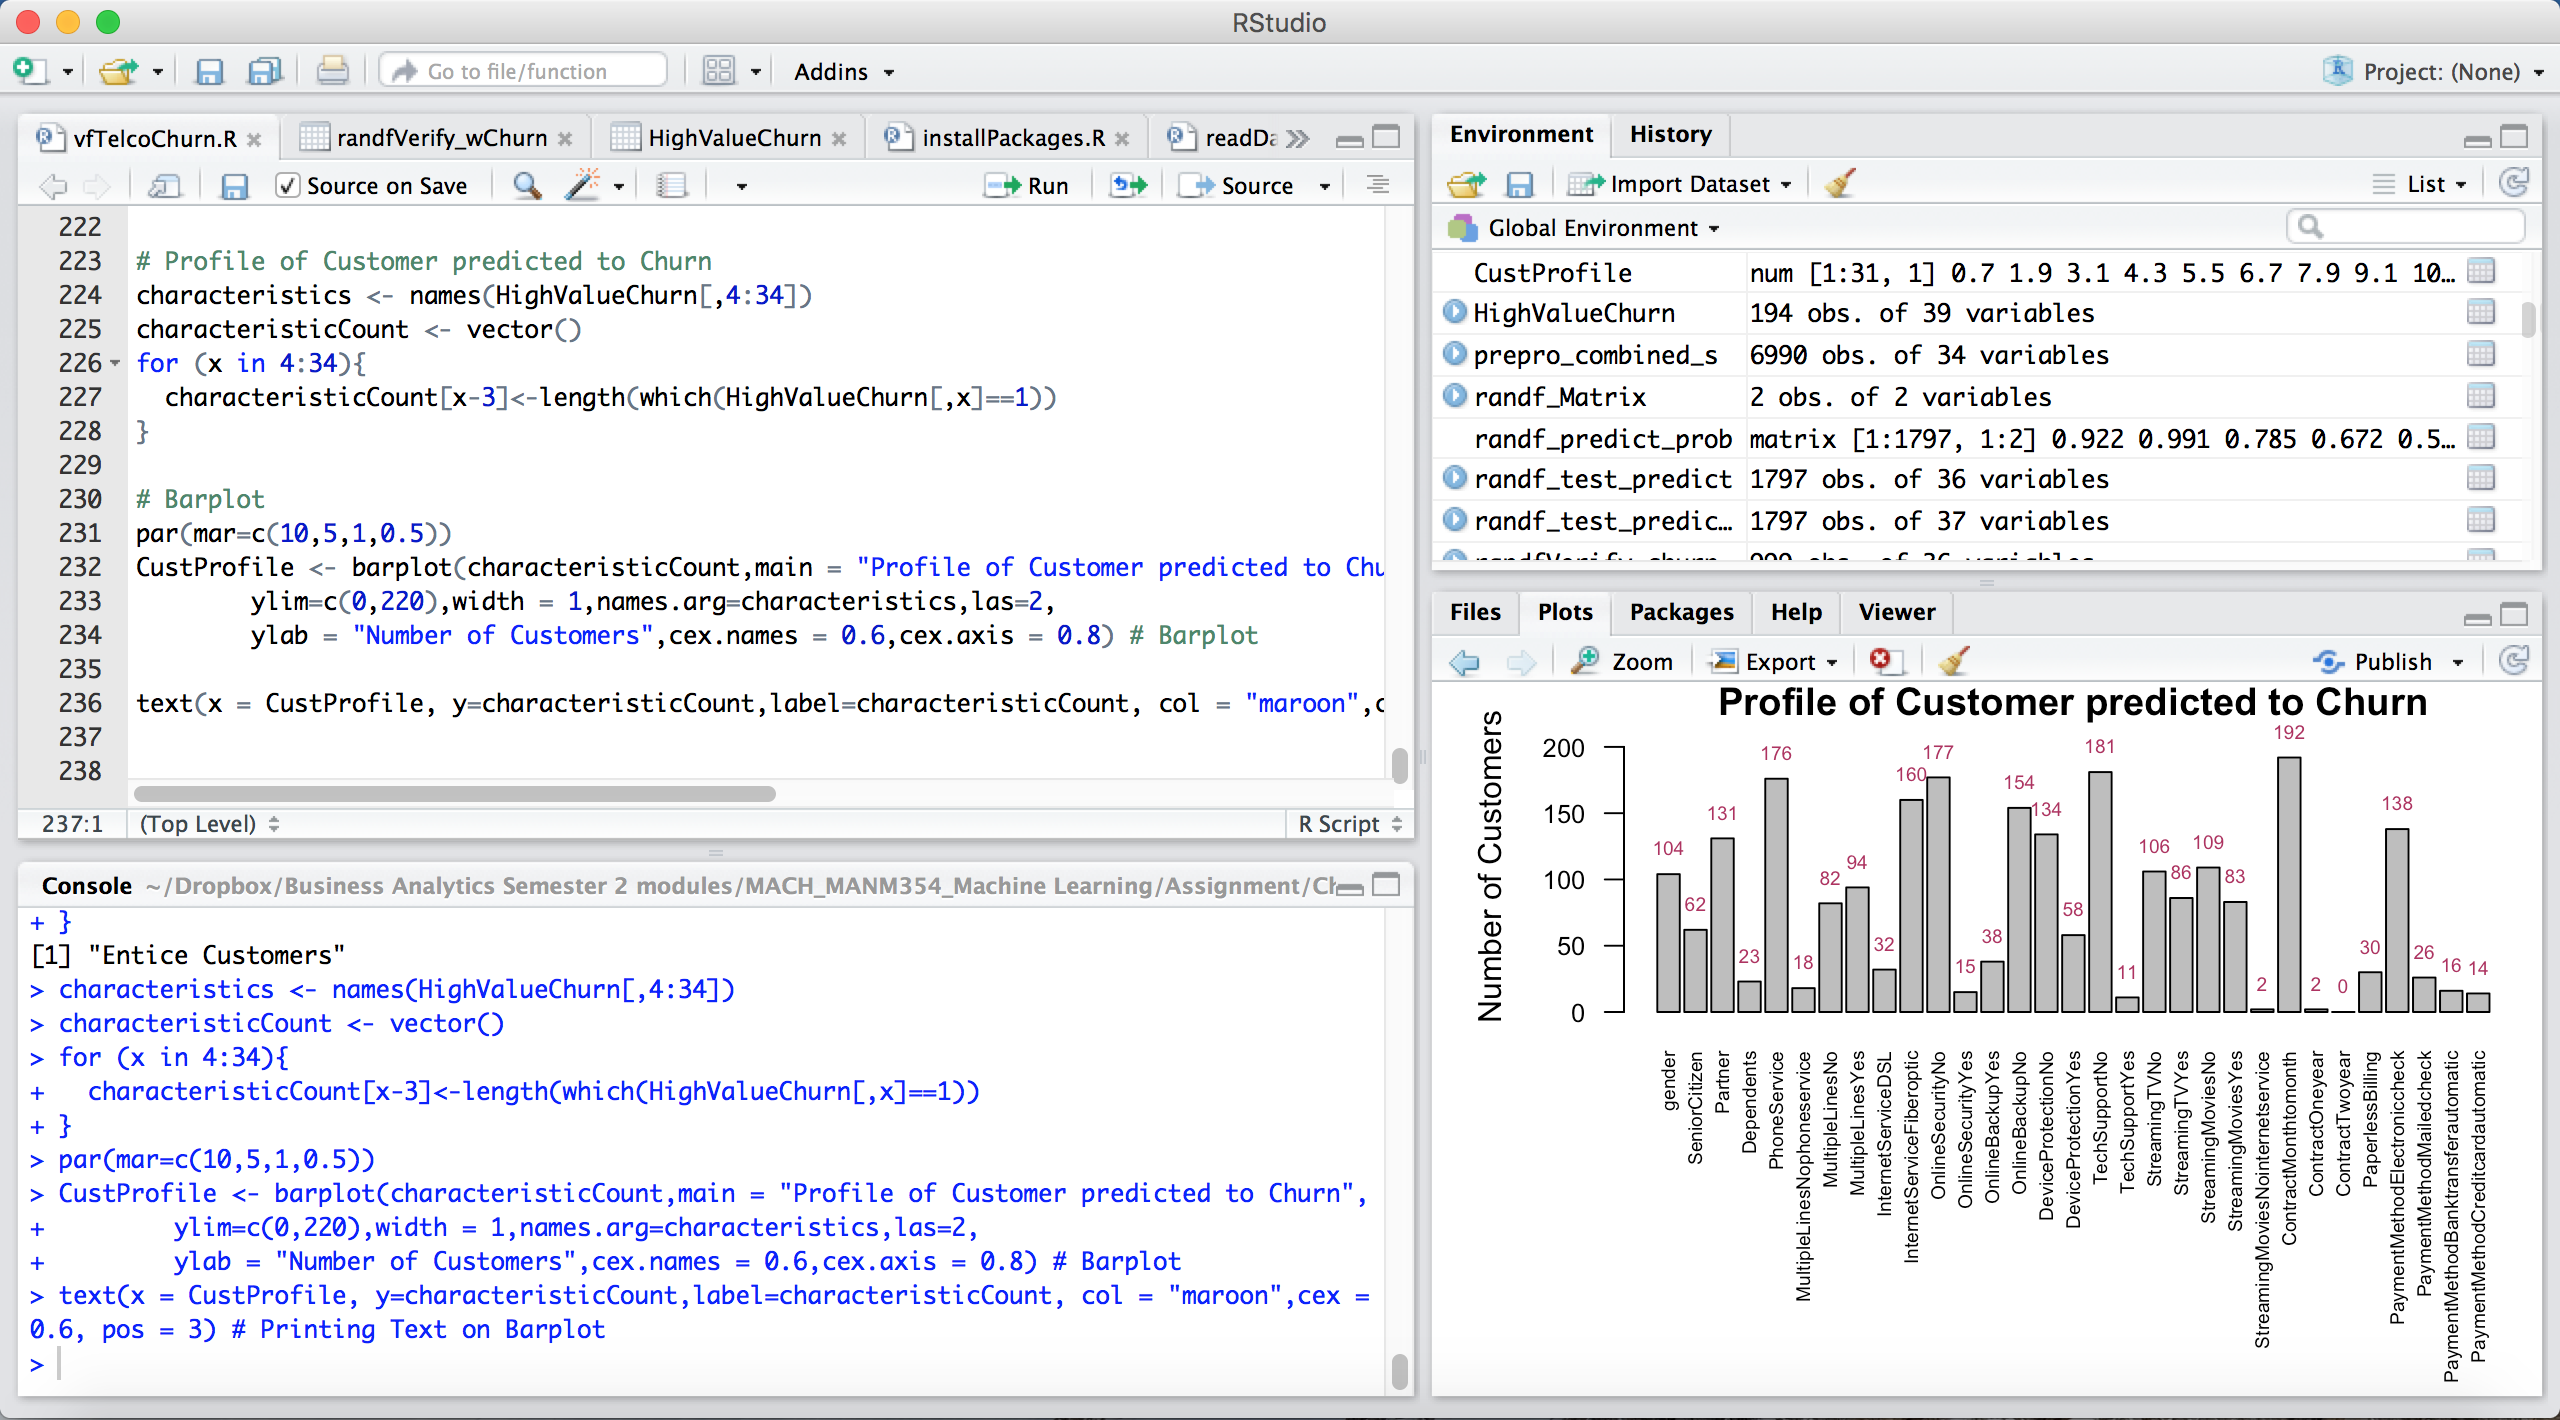
I know it all sounds very technical and pretty boring but this here is just one of hundreds or even thousands of possible applications of predictive analytics.
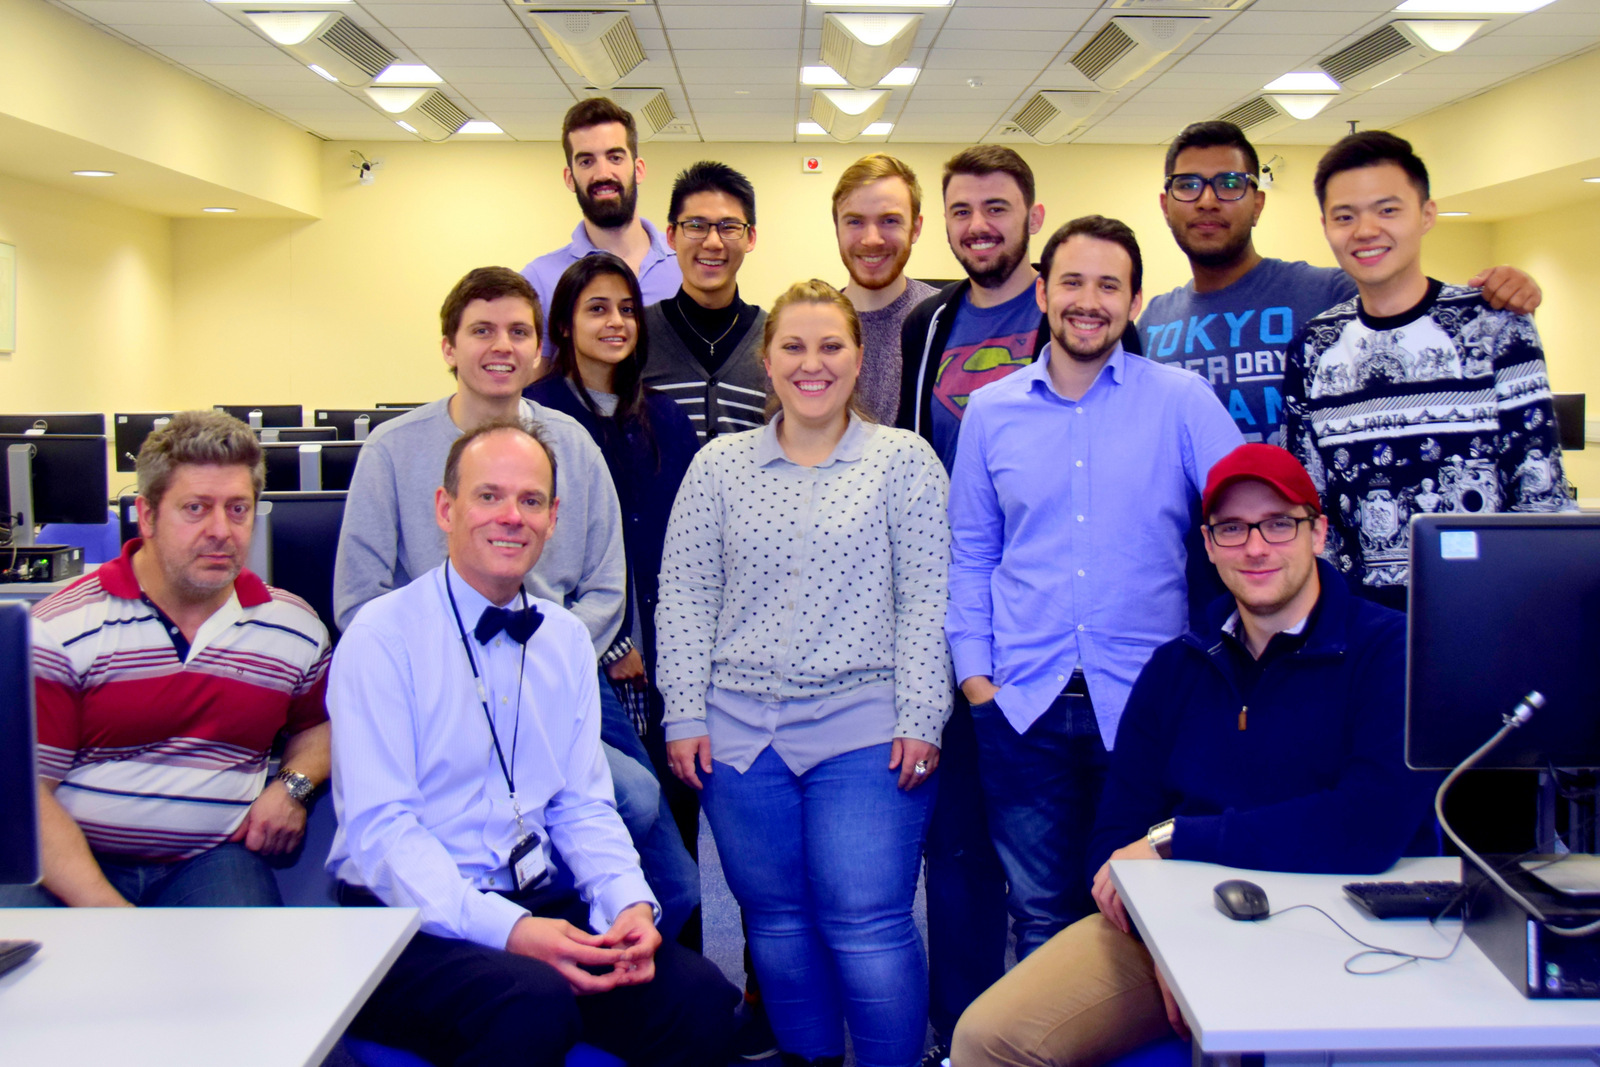
This is our MSc Business Analytics group with our very experienced Machine Learning Expert professor, Dr Nick:
With that, we had our 2 big assignments submitted and we can now focus on our upcoming exams… except that we have one more big 100%-worth research paper that’s due during the exams. For now, I just need a little 3 day break from work to rest up before getting back into the rhythm of my research again.
It was just in time too, because the Singapore Society organised the last event for the current academic year by the lake in midweek, on a sunny Wednesday afternoon. See if you can spot your two Singapore ambassadors here:
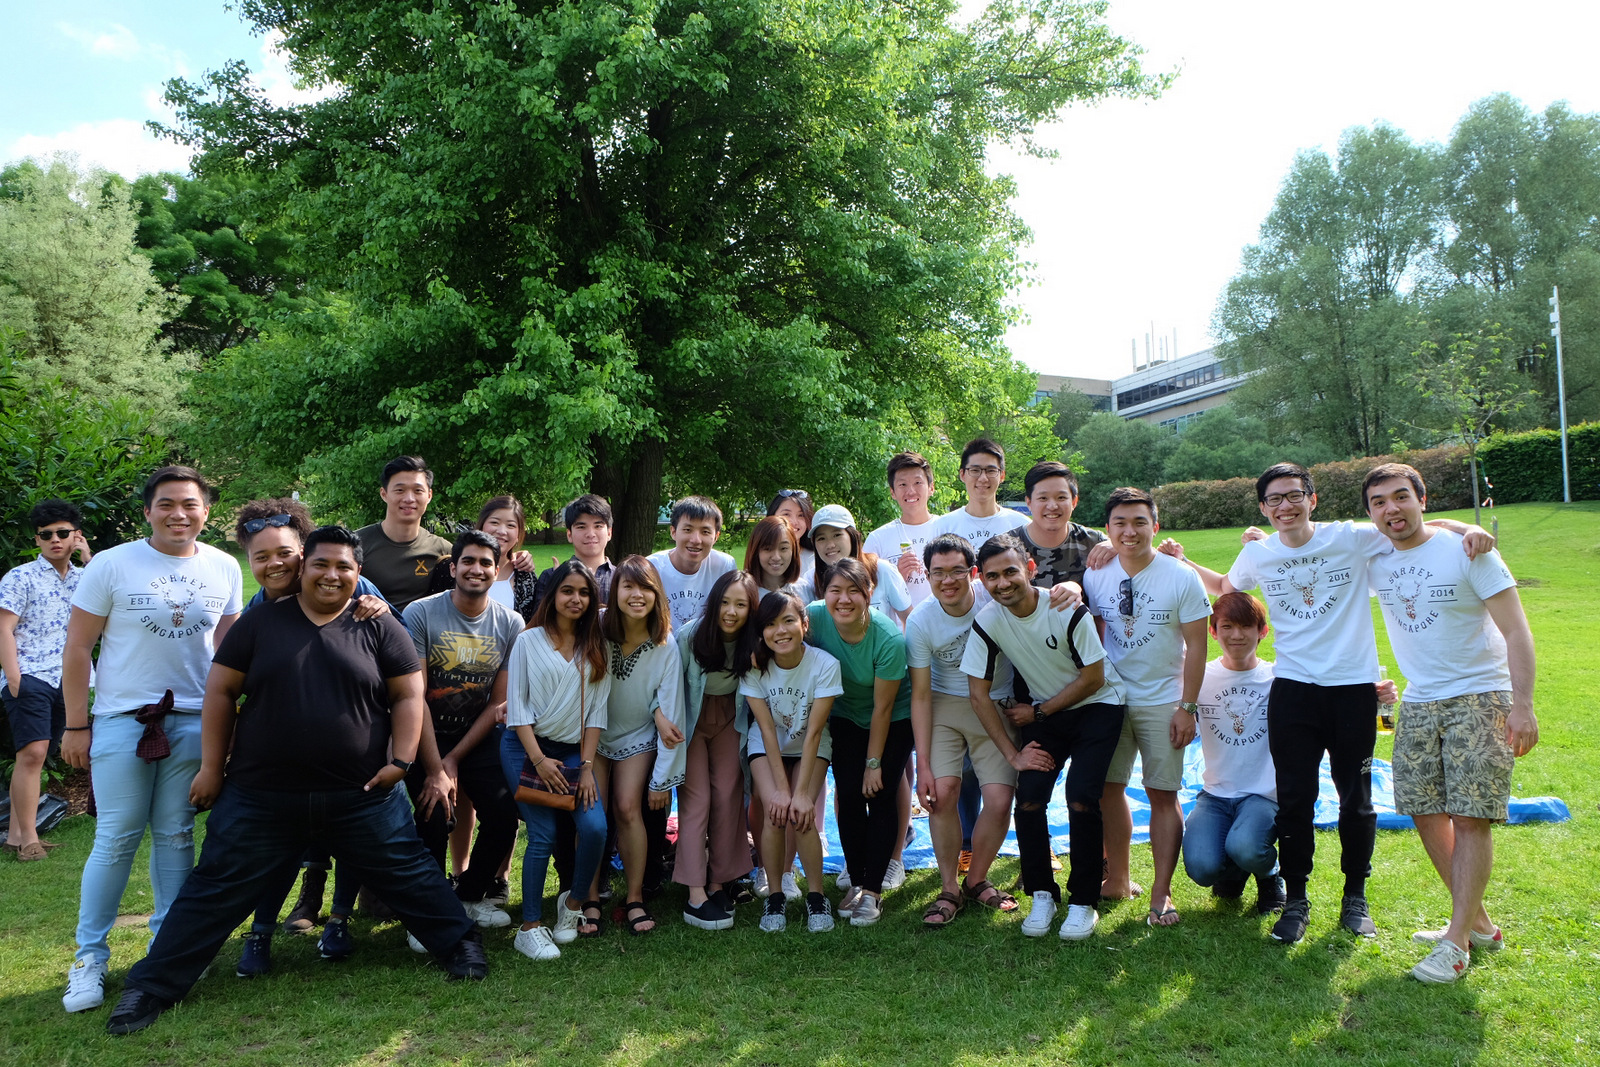
It’s nice to be around young undergrads sometimes. Everyone’s full of energy with some being a good handful of years younger than I am 😜
Right then… I’ll be focusing on my big research paper over the next week or so as well as the exams so I’d probably be back after the exam period.
Until then, take care and God bless! 🌈
Ben