The results of this year’s National Student Survey (NSS) are now out – go here and type “physics” and “Surrey” in the relevant boxes to get the Department’s numbers. The headline figure is that 98% of the students who filled in the NSS questionaire are satisfied with the course. Great. As an academic who has taught all these students I am very happy about this vote of confidence.
As this number goes into the University league tables (in the Guardian, Independent etc) this presumably means that we will go up all these league tables next year. That will be nice.
But you may be wondering: How reliable is this figure of 98%? If so you are reading the right blog post.
Answering this question is a data-analysis problem so I should be good at it. In fact it is a problem made for analysis using Bayes’ Theorem. I have mentioned this in earlier posts – I am big fan of Bayes. I will give the answer first, how I got it may have to wait for another post. The answer is the green curve below:
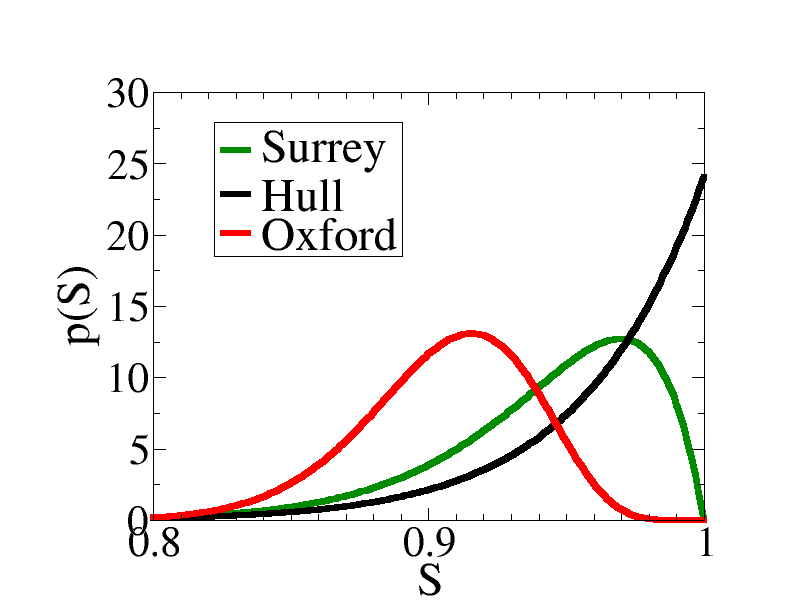
Here S is the true probability that a randomly selected student is satisfied, and p(S) is the probability that the true probability of a Surrey Physics student being satisfied with their course is S.
That was quite confusing, because it is the probability that another probability takes a certain value, which is the sort of thing that can make your head hurt. But it is at heart quite simple so I will try and explain.
The data the Surrey number is based on is the response of 33 final-year Physics students at Surrey. Now from the details that you can get to if you follow links in the site it looks like 32 of these 33 students ticked boxes indicating they agreed or agreed strongly with the statement that they were satisfied with their course. The remaining 1 student was less impressed.
As an aside the ones among you who are doing sums in your head as you do this will realise that 32/33 = 97% not 98%, and indeed a spreedsheet that went round internally at Surrey had this figure. The NSS website has 98% for some reason but I don’t see how you can get 98% from 33 responses, and rounding to the nearest 1%. But anyway, let us work with 32/33 = 97% satisfied.
The Department has more than 33 students – completing the survey is not compulsory. Thus there will be an unknown error in the NSS figure of 97%. In reality, the fraction of students satisfied may actually be a bit higher or maybe a bit lower.
For example, let us say you have 100 students and want to know how many like chocolate ice cream. You only ask 50 of them, and 25 say yes. Your estimate of the probability a student likes chocolate ice cream is 25/50 = 50% but this figure could be a little low or a little high. Maybe the 50 you asked just by chance contain more than half of the 100 students who like chocolate ice cream. Then your estimate of 50% would be overestimate of the true figure.
The same goes for an NSS score. The figure is an estimate, in general it will not be precisely the right number, there will be some error.
This is what the plot above shows. For Surrey, the true fraction of students that are satisfied is mostly like to be around 0.97, or 97%, but it could be say 95% or 99%, e tc. If you look at the green curve above although p(S) is smaller for 0.95 than for 0.97, p(S) is not equal to 0 at 0.95. This means that it more likely that 97% of students are satisfied than that 95% of students are satisfied we cannot rule out the possibility that 95% of students are satisfied.
Anyway, for comparison I have put on Hull’s result and Oxford’s result. I picked Hull as they top the league table with an NSS score of 100%. All 23 students who filled in the questionnaire at Hull were satisfied. However, as you can see from the black curve that does not guarantee that all Hull students are satisfied.
Oxford are a lot farther down the NSS league table than Hull and Surrey, which is reflected in the peak of the red curve being at lower values. However, due to the uncertainties in the numbers this does not guarantee that students at Oxford are less satisfied than those at Surrey.
You can integrate the curves and get that the probability that students are happier at Surrey than Oxford is around 80%. So it is likely our students are happier but it is not absolutely certain, few things that matter are. Almost all numbers you come across in science or in University statistics have errors in them, it is important to bear this in mind whether you are looking for the Higgs boson, or a university to study at.
PS For those of you that do Bayes’ stats, details are that I assumed a uniform prior and that the total number of students was large.