 This is a departure from my usual posts. It is real science, done by me. For a change I thought I would show you a little bit of scientific research being done, and a little nugget of understanding about a physical process being gained. Some aspects of this are a bit technical, so I have relegated them to footnotes. If you want to skip them, feel free to ignore them. Anyway, basically what I am going to do is to compare two different models with some real experimental data, conclude that one model works better and then see what this tells me.
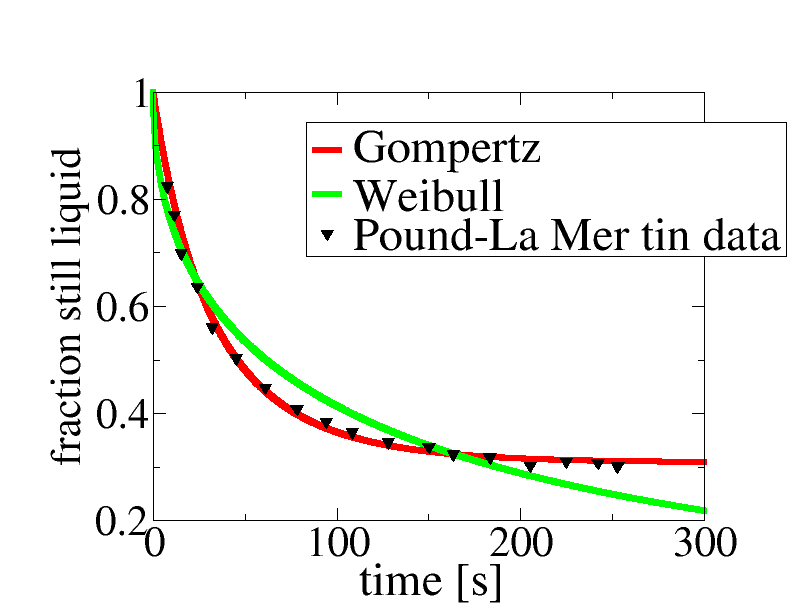
Way back in 1952 two scientists, Pound and La Mer, wanted to understand how small droplets of liquid tin froze. They studied a set of many droplets of liquid tin, by heating them to melt them, then cooling them down to 114.6 C. This is far below the temperature at which tin melts, which is 232 C. But freezing can be slow. You can see how slow above1. The black triangles show what fraction of the tin droplets was still liquid, i.e., had not frozen, as a function of temperature. For example, you can see that after 100 s, maybe 38% of the droplets had not yet frozen. Their experiment lasted for around 250 s (a bit more than 4 minutes), after which about 30% of the droplets had still not frozen.
OK, so we know that most but not all of the droplets crystallise in around 4 mins. Can we be more quantitative? Well we can try a couple of different models. These are the Weibull model (green curve) and the Gompertz model (red curve). Both models are fitted to the data2. Clearly, one model function, Gompertz, fits the data almost perfectly, while the other one, Weibull, is terrible.
There is a clear winner, the Gompertz model, but what does this mean? The short answer is that I do not know.
But maybe we can make some progress. Clearly the Weibull model is ruled out by the data, so something is wrong with it. What? Well the Weibull model basically assumes: 1) that each droplet has the approximately same number N >> 1 of sites where freezing can start; 2) that the freezing occurs whenever it starts at any one of these sites; 3) that the times for freezing at these sites are distributed according to some smooth distribution that goes down to zero3. The middle one of these assumptions is probably OK, it really should be the case that all it takes is for crystallisation to occur is for it to start at one of the sites. So the data suggest that different droplets either have different numbers of sites where crystallisation can start, or that somehow the distribution is jagged, due perhaps from it being due to contributions from more than one source.
On the other hand, the Gompertz model fits the data very well. What does the Gompertz model assume? Awkwardly there are two completely different ways to derive it4. The way I think is more plausible here is as follows. You assume that crystallisation starts off on one of a handful (< 10) of impurity (dirt) particles inside the tin droplet. Each particle of dirt is assumed identical but the time to crystallise varies from one tin droplet to another because just by chance some droplets have more particles of dirt than others5. The fit above corresponds to an average of about 1.2 dirt particles per liquid droplet2, but some droplets have more than this average number and some have fewer. About 30% of the droplets have no dirt at all and so never freeze – you can see this as both the data and the red curve reach a plateau at about 0.3, and then don’t drop any further6.
In a nutshell the Gompertz model is based on the idea that the droplets have a handful (< 10) of small particles and that some droplets freeze fast as by chance they have more than the average number of dirt particles, but some never freeze as by chance they have none. By contrast the Weibull model is based on the idea that there are many many sites but some are much better than others at inducing freezing. The fact the Gompertz fits the data so much better suggests that indeed the droplet to droplet variability is due to variability in just a handful of particles in the droplets. Maybe. This is just a tentative conclusion, as are many conclusions in scientific research, but at least I know more than when I started to plot the data and do the fits. And that is scientific progress.
—–
1I read the data here from experiment 29, run 4 of the Fig. 3 in the original paper, using datathief, so ta to them.
2Not directly fitted. For the Weibull model: You can write the Weibull model for the fraction F(t) as ln[-ln[F(t)]] = a+b*ln[t], i.e., if you plot ln[-ln[F(t)]] vs. ln[t] you should get a straight line, and it is better to fit to data plotted like this. Incidentally, on this plot the data do not fall on a straight line – good evidence that the Weibull model does not describe the data well. For the Gompertz model: You can write the Gompertz model as ln[F(t)] = – m[1-exp(kt)], and I fit to that. The best fit values are m = 1.18 and k = 0.019 /s. Here m is the mean number of dirt particles per tin droplet, and k is the rate per dirt particle.
3To get a Weibull this smooth distribution kind of has to be a power law, but a maths theorem says that for large enough N it should tend to a power law.
4The usual way of obtaining the Gompertz model function is not what I describe here. Here I am actually following a simplified version of a model Pound and La Mer themselves derived, which when I have simplified it becomes mathematically equivalent to the Gompertz model.
5You may have noticed I talk a lot about variability in the droplets of tin. If all the droplets were identical the fraction not frozen would be a simple exponential. You should be to see that the data do not fall on a simple exponential. So the tin droplets cannot all be the same.
6Each impurity contributes k which is about 0.02/s to the rate of freezing, i.e., droplets with one impurity freeze at a rate of 0.02/s, droplets with two impurity particles at 0.04/s, etc.