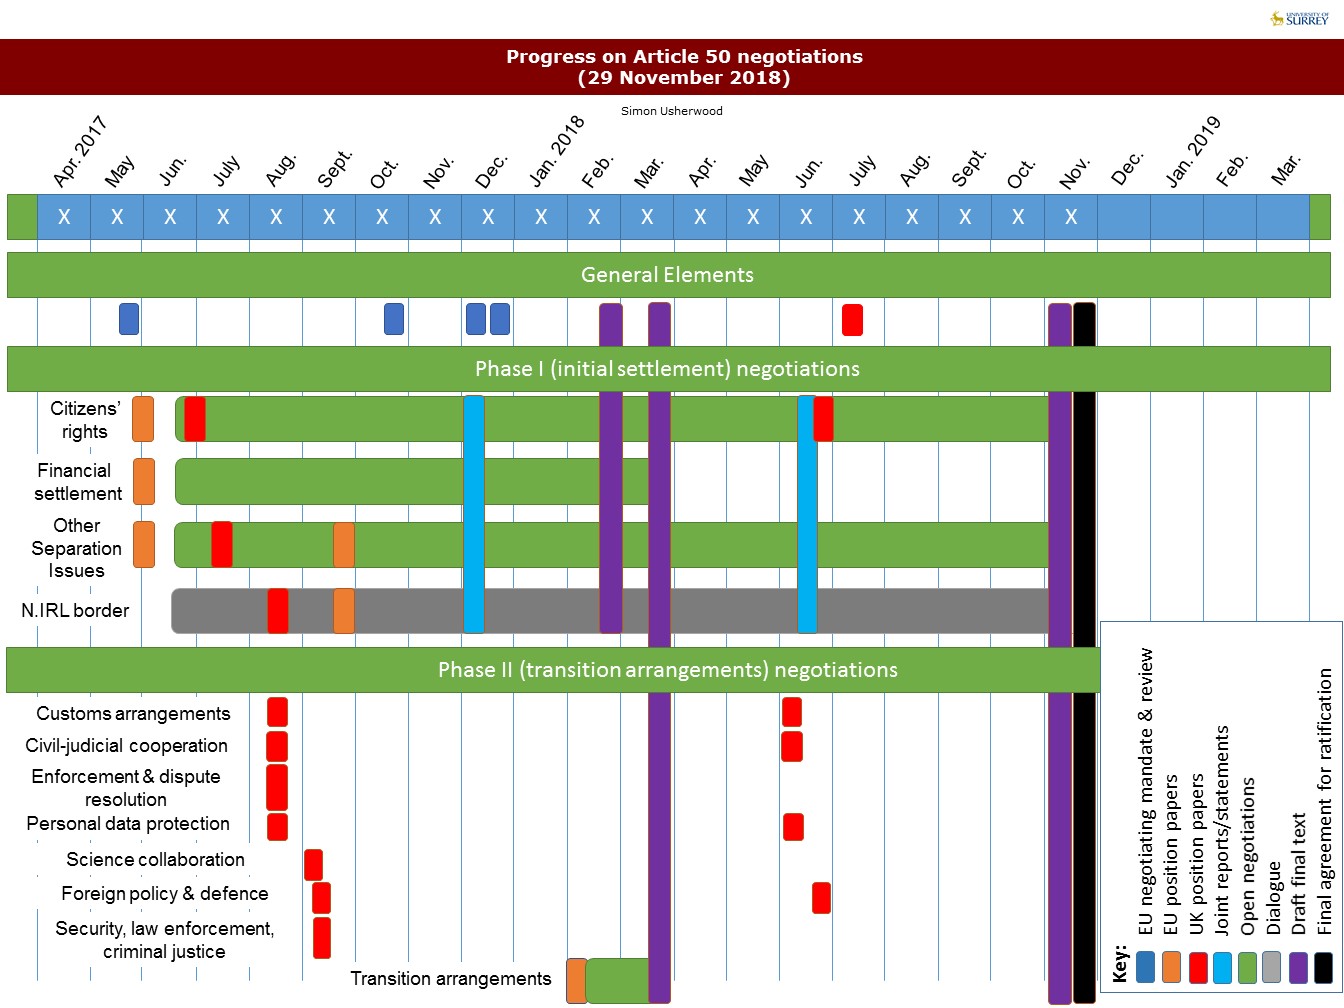
So, a bit of landmark moment for this series of posts: we have a finalised text on the Withdrawal Agreement.
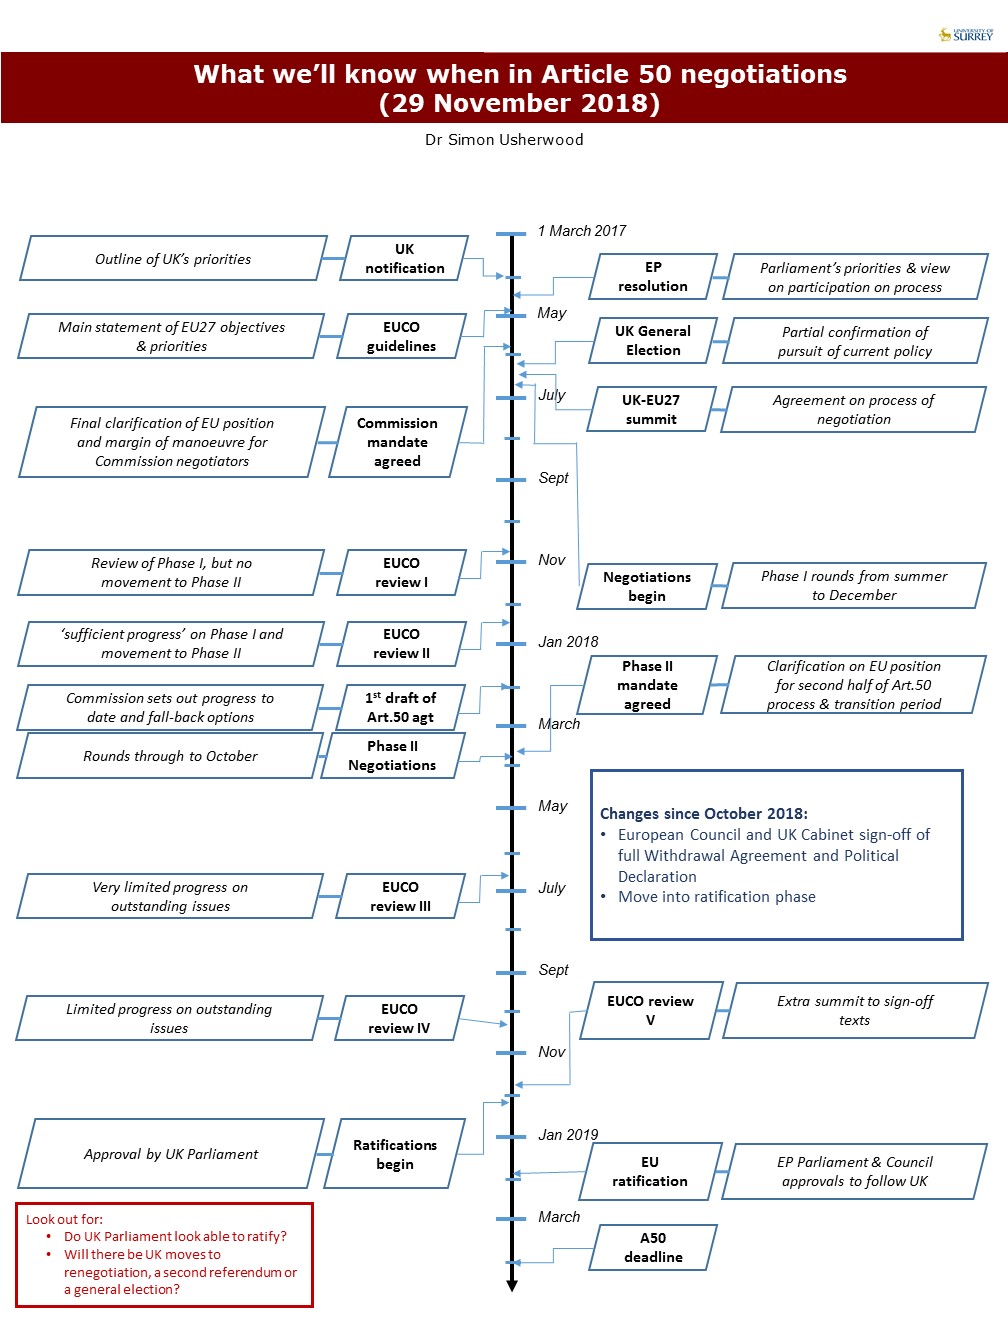
For many long periods since March 2017, I’ve wondered if it would ever come to pass, not least since the usage of time seemed rather cavalier (check the big gaps in the timeline below).
But it’s happened, with the requisite hiccup following the October European Council, so now we move into the ratification phase, which looks fairly hellish for Theresa May.
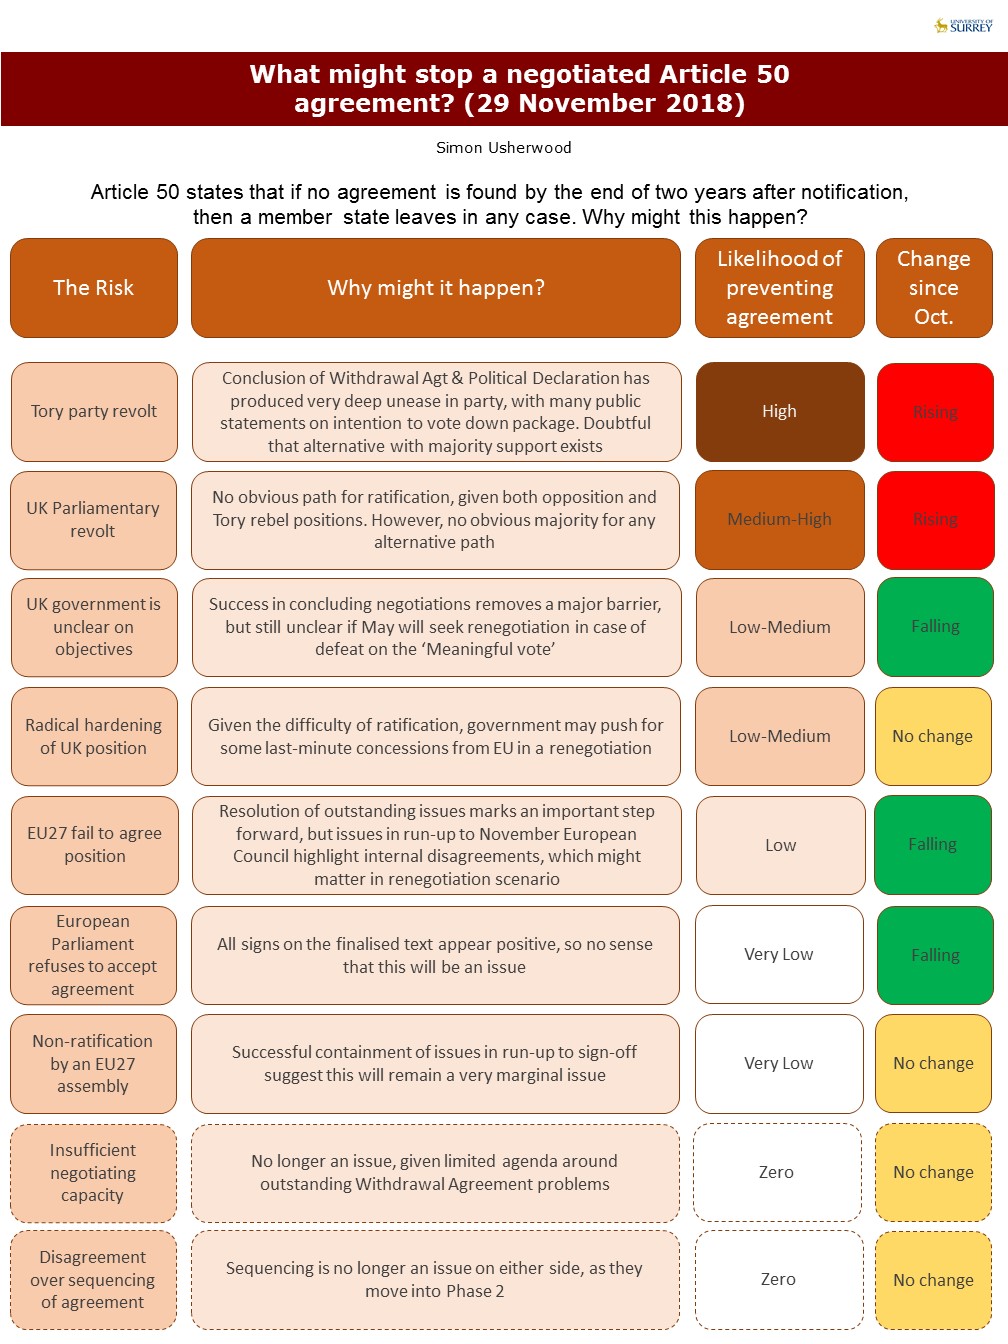
This is all reflected in the graphics below: lots of movement, especially on the risk register, which has swung very heavily to UK-focused barriers to a negotiated conclusion. Indeed, some of the movements are bigger than any I’ve made before – in both directions – because the parameters have changed very radically. The closing of the text (pace any renegotiation gambit) means that while risks on negotiation have dropped significantly, they have been balanced by a rise in the likelihood of UK opposition.
This is best understood by the move from potential costs to actual ones, since the text is the text and the margin for ambiguity for the UK government is very much smaller.
So even as we clear one hurdle, we set up another one.
Maybe by the time I do my December update (probably in the week before Christmas), we’ll have more of a sense of how this plays out. Then again, I recall writing the same thing month after month during the negotiation phase.
Hardhats on!
PDF versions: A50 progress Nov 18; A50 barriers Nov 18; A50 timeline Nov 18